


Swuste, Paul
Safety Science Group / Delft University of Technology / Postbox 5015, 2600 GA / Delft, The Netherlands+31 15 278 3820/1477/p.h.j.j.swuste@tuddelft.nl
ABSTRACT
ABSTRACT
Vertical transport by mobile cranes will be used a an example of risk assessment in the construction industry. With a presentation of accident causality, the bowtie model, accident scenario’s are classified, based upon major crane accidents recorded by the Dutch Factory Inspectorate. Beside dominant accident scenario’s, managerial influence on these scenario’s are discussed, as well as the quality of the data provided.
keywords
keywords
Crane safety, building industry, accident scenario’s, prevention management
INTRODUCTION
INTRODUCTION
In the domain of occupational safety, risk is defined as the likelihood of unwanted events, and risk assessment refers to techniques and tools to assess conditions, which in the future may endanger the safety of a system. There are quite some tools and techniques available, ranging from ranking tools, like relative ranking and rapid ranking, to more sophisticated tools like Probabilistic Risk Assessment. Usually these tools combine a graphical representation, how the unwanted events may happen, with an estimation, or a calculation of the probability these events will take place.
Risk assessment is focussed on prevention, and it is generally accepted thatprevention is better that cure. But it is believes that our technical systems have become so complex, that these unwanted events we would like to prevent should be considered as normal events, leading to normal accidents and making prevention an extremely difficult concept (Perrow, 1984). Also people responsible usually walk with blinkers on, as long as major accidents have not occurred. It seems difficult to invest in prevention. This often repeated message was again underpinned by one of the keynote speakers at the recent Working on Safety Conference in Holland. Many industry people often find it hard in practice to weigh a certain expense, the cost of prevention, against an uncertain gain, an accident avoided. Therefore they prefer to concentrate on what has happened, rather than on what possibly may happen (Hollnagel, 2008).
This presentation on risk assessment in the construction industry will use vertical transport by mobile cranes as an example. The results of a study on this topic were recently published in The Netherlands (Swuste, 2005). The focus will be on a graphical representation of accidents with these installations, and on models to understand accident causality. Unfortunately not a complete risk assessment can be presented, due to limitations of exposure data, but instead the presentation will be directed to the dominant accident scenarios of during these hoisting activities, and the influence of managerial factors on these scenarios.
BIG BLUE
Vertical lifting of loads is a rather hazardous operation. Although the number of registered accidents in The Netherlands is relatively low, only 174 in the 6 years period, the consequences are mostly severe, due to the mass of the loads lifted and of the installations involved in lifting (Paas and Swuste, 2006; Aneziris et al., 2008). Accidents with cranes are shown in media every once in a while, and always result is spectacular pictures. A famous accident is one occurring in the US, in Milwaukee in 1999. Regular viewers of Discovery Channel are probably familiar with the ‘Big Blue’ accident, as the crane involved was known (JS Online, 2006). The crane itself was a modern giant, with a counterweight of 1150 tons and a boom of 172 meter. The left side of figure 1 shows the V shaped crane with an extended jib, while hoisting a roof element of 400 tons. At one moment the crane collapsed, leaving nothing more than a heap of scrap, as is shown in the right side of figure 1.
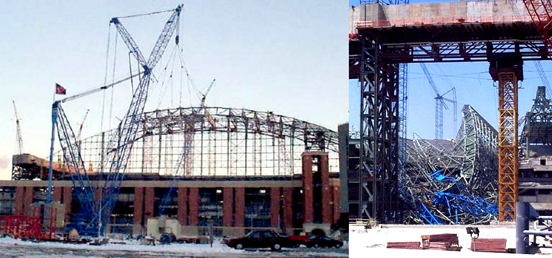
Figure 1 Big Blue, Milwaukee 1999, before (left) and after (right) the accident
A detailed analysis of this accident revealed that external conditions, a sudden gust of wind, created load instability and a consequential extreme torsion in the boom, leading to jib instability and finally to the crash of the crane. Apart from this direct cause of the accident the analysis also showed additional factors of accident causation, also called managerial factors. The time pressure under which the project has to be performed was such a factor, as well as the decision to start hoisting at the limits of acceptable weather conditions. In safety science this phenomenon is called ‘conflict resolution’; pointing at possible conflicts that can occur between safety and other company goals, like for instance production pressure.
One can only conclude afterwards that apparently major accident scenarios were not taken seriously in managing this hoisting activity. Or in more general terms that these accident scenarios only played a minor role in decision making, and accident causation models were not an active part of the operational safety management system.
Cranes can be risky installations, and this is confirmed by data from the
Dutch Census Bureau. In The Netherlands in 2004, 93 people were killed by an occupational accident. Transport equipment was involved in three out of ten fatal accidents, either being a crane, a shovel or an elevator (CBS, 2006). Unfortunately, separate data on mobile cranes are not available. Data from Portugal do not allow making a distinction in the type of equipment involved in fatal accidents. However,an epidemiological survey showed high mortality rates in the construction industry (Macedo and Silva, 2005).
GRAPHIC PRESENTATION OF ACCIDENTS
Graphic presentations of accident causation exist already for some decades. The archetype of these presentations is the simple linear model of Heinrich (1931); the Domino presentation. This model explains accidents as a linear propagation of a chain of causes and events, with an unsafe act of a person and a mechanical or physical hazard as its main components, or dominos. In the 1990s the focus was changed, and more emphasis was put on the so-called latent conditions within technological organisations (Reason, 1990, 1997). These latent conditions are closely associated with systems possessing several defences-in-depth, and contribute to the breakdown of the system defences. Latent conditions are always present in complex systems, and examples are: poor design, gaps in supervision, undetected manufacturing defects, defects or maintenance failures, unworkable procedures, clumsy automation, shortfalls in training, or less than adequate tools and equipment. Latent conditions may be present for many years before they combine with local circumstances and active failures to penetrate the many layers of defences. The biggest threat is not the isolated human errors of workers at the sharp end of an accident or disaster sequence, but the accumulation of latent failures. Therefore human errors and failures are not seen as causes, but as consequences.
Bowtie
A recent graphic presentation of accident causation is known under the ordinary name of bowtie, and defines accident scenarios and managerial factors. The bow tie presents a combination of a fault tree and an event tree, linked together by a ‘central event’ (figure 2).
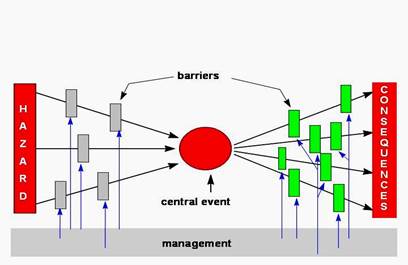
Figure 2 Bowtie presentation
Starting from a hazard, defined as the intrinsic property of a situation, a process, a substance, or equipment, various accident scenarios are leading to the central event. This central event reflects a situation of a ‘loss of control; the energy of the hazard is uncontrollably released. A falling object from a crane, for instance, is an example of loss of control. From the central event onwards the event tree on the right side of the bowtie describes the scenario pathways leading to different kinds of damage. Accident scenarios are the black lines in figure 2; they describe the events occurring from hazard via the central event to the consequences.
This way of presenting (major) accidents has some advantages. The model focuses risk prevention activities to central events. Companies can focus their attention on central events they would like to avoid most, either guided by past experience, or guided by the notion that some central events will jeopardize their production. It is astonishing to see that most companies only have vague ideas on central events they need to avoid.
The bowtie model directs the attention towards various barriers to preventscenarios from propagating. This is a second advantage of this model. These barriers block the stream of energy. They usually are a combination of hardware devices and human interventions, also called primary barriers. But the quality of these primary barriers is determined by management factors. These management factors provide a clear link with safety management systems, because management decides which type of barrier is relevant for which hazard, or risk, and for which scenario. At the bottom line management of safety is nothing more than managing barriers, to provide, install, and maintain them, to develop procedures and training when necessary as well as inspection.
Finally the bowtie model has scenarios as a main component of the model,either for major or for minor accidents. This difference between different types of accidents is important. It is a common belief that minor and major accidents share the same causes, or accident scenarios and their consequences are largely governed by chance. The well known accident triangles on the relation between major and minor accidents are based upon this assumption (Heinrich, 1931). But quite some references in the field of safety science argue an opposite view. Lost- time and non-lost-time industrial accidents show a different pattern (Shannon and Manning, 1980). And also between fatal and non-fatal occupational accidents different mechanisms of causation have been demonstrated (see for instance Salminen et al. 1992; Salonemi and Oksanen, 1998). This means that differences in severity of scenarios is basically a difference in accident scenarios. The amount of energy locked up in a process and released by the accident process will significantly determine the amount of damage done (Hale, 2002). The observation of differences in accident scenarios is very relevant for risk prevention activities. If central events from minor accidents do not contribute to major accidents, because of differences in pathways, then it does not make sense to try to prevent major accidents by conquering minor ones.
In The Netherlands the bowtie is being used for the analysis of accidentsreports of the Factory Inspectorate (Mud, 2005), but also audit applications have been developed, and tested. Recent publications on scenario based auditing look very promising (Guldenmund et al. 2006; Zemering and Swuste, 2005).
Central events
Falling from heights is an important central event, and as is shown in figure 3 this central event used to be dominant during maintenance activities of major constructions, like the Tour Eiffel. It is not difficult to imagine scenarios which will lead to this central event, due to the absence of primary barriers.
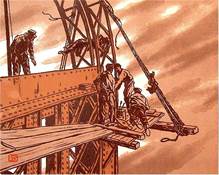
Figure 3 Henri Rivière, Maintenance activities at the Tour Eiffel, 1902
Another example, again historically, is coming from Italy. Philipo Brunelleschi, the master builder of the dome of the Florence cathedral Santa Maria del Fiore in the 15th century had build a so-called parapetto at the inside of the high vault. This balcony on hanging scaffolding operated as a safety net. The balcony is visible at the left picture of figure 4.
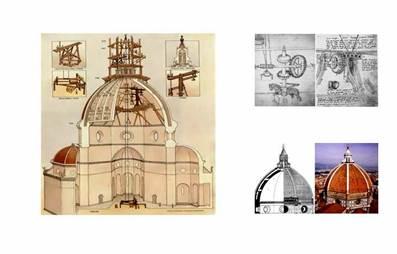
Figure 4 Brunelleschi’s dome, Florence
During construction other safety measures were taken. Bricklayers, working high at the walls were provided with a leather harness, and their wine was diluted with water for a third, which actually was a recipe for pregnant women. Everybody violating these rules had to pay a fine of 10 lire, a salary for a week’s work. Workers were also forbidden to lift their tools, and even themselves in the bin of the hoisting equipment. They also were not allowed to swing in the bins to catch pigeons. The combination of these primary barriers and management factors has proofed to be rather successful. During construction, which lasted 50 years, only two fatal accidents occurred, both caused by falling from heights. This safety record was miraculous, if one takes into account the number of workers involved and the long period of construction (King, 2000). The right side of figure 4 shows details of the hoisting equipment.
But also nowadays this central event still ranks number one on the list of central events from accidents occurring in The Netherlands, as can be seen from table 1. Apparently we are not able to reduce scenarios leading to this central event.
|
Central events (n = 12.655) |
% |
|
Falling from heights |
30 |
|
Contact with moving parts of fixed machinery |
27 |
|
Contact with falling objects |
11 |
|
Stuck by vehicle |
6 |
|
Loss of control in or on moving vehicles |
3 |
|
Contact with hoisted, hanging, swinging objects |
3 |
|
Contact with object a person in holding, using, carrying |
3 |
|
Loss of control of hazardous chemicals |
3 |
|
Contact with handheld tools |
2 |
|
Contact of moving person against object |
2 |
|
Contact with charged objects |
2 |
Table 1 Central events from the Dutch accident registration, 1998-2003
Table 1 derives from a large project on accident causation in The Netherlands, using all accident reports (n = 12.655) from the Dutch Factory Inspectorate. This
5registration contains all serious and fatal occupational accidents in the period 1998– 2003, and provides an overview across all branches of industry (Hale et al., 2005; Ale et al., 2008; Bellamy et al., 2008; Mud, 2005; Mud et al., 2006).
VERTICAL LIFTING OF LOADS
Central events during hoisting activities
The central registration system allowed us to take a closer look at the central events occurring during hoisting activities. An overview is given in table 2. This table shows the dominant position of load instabilities, either occurring during hooking loads, or during load transport.
|
Central events of hoisting activities (n=174) |
% |
|
Instability load |
72 |
|
Contact counter weight, or jib |
11 |
|
Instability crane |
7 |
|
Instability hoisting gear |
5 |
|
Instability jib |
3 |
Table 2 Central events of hoisting activities
The contacts with counter weights and jibs describe accidents which happen during crane movements, when people are hit by moving counter weights or jibs. The other central events, like crane instability due for instance to ground instability, breaking hoisting cables (instability hoisting gear), or mechanical failures on jibs occur much less frequently. This reflects the high technological level of most cranes, which are equipped with all sorts of sensors to detect these events. A closer look at the first central event, instability of load, will give an impression on the type of barrier failures occurring (table 3).
Barrier failures, instability load
Primary barriers (hardware) Improper connection load, equipment failure
Failing load securing mechanism, killer hook Management factors Improper connection, conflict resolution
Improper connection, competence failure Ground location failure, communication failure
Substandard external conditions, conflict resolution (big blue)
Table 3 Barrier failures, hardware and management factors, during load instability
This table is divided between failures of primary barriers (hardware) and management factors. Improper connection is a failure during hooking up the load, and hardware failures refer to braking hoisting chains or ropes.
The killer hook in the table is a hook with a lacking or deficient safety device allowing hoisting ropes to slip out of the hook. At the management factors the earlier mentioned conflict resolution appears, meaning the hooking up of the load was carried out too hastily, and inadequately, due to time pressures. Competence failure refers to the competence of the man hooking up the load, he had no proper knowledge to execute the job adequately, including the use of hardware barriers. And the ground location failure is the presence of workers inside the hoisting path.
6
The communication failure refers to the lack of communication between the crane driver and these workers.
CONCLUDING REMARKS
Due to the numbers, the order of ranking of central events during hoisting activities is rather convincing. Against the popular believe, and the media attention like the Big Blue accident, scenarios leading to crane instability are far less dominant than scenarios leading to load instability.
The analysis of the accident registration allowed determining managerialfactors, which influence the quality of primary barriers. It is the first time these managerial factors are assigned for hoisting activities. The information presented is limited to a qualitative branch wise description of these factors, meaning that only general remarks can be made on conflict resolution, competence and communication. To explore the full potential of these management factors, the analysis should be conducted company specific. Such a company specific analysis allows a detailed assessment how, and to what extend these factors can corrupt primary barriers, and consequently focus on shortcomings of operational safety management systems. Unfortunately such a detailed analysis was not possible. Therefore the determination of management factors should be seen as a first try- out, as a fishing expedition.
Another limitation of the study is already mentioned in the introduction. The lack of exposure information limited the possibility to conduct a risk assessment. Instead the centre of attention was directed towards the graphical presentation of accidents occurring, the bowtie. This presentation is a complex, but still a linear visualisation of accident causation. Technically a bowtie is more complex than the domino presentation, because accident causation is no longer seen as a single linear propagation of an effect. In the bowtie presentation more than one scenario can lead to a given central event and managerial factors are included, influencing barrier performances. But still an accident is the result of failures of primary barriers, of individual components, meaning the presentation is still linear.
Accidents in complex systems, and most notably the major ones and disasters which follow a different scenario that minor accidents, hardly occur in a linear mode. These major accidents can only be understood as an unexpected combination of conditions or events, which are by definition non-linear and dynamic. These events can occur simultaneously, while affecting each other. Complex systems are dynamic, and a state of dynamic stability can change into a state of dynamic instability, like a disaster which occurs abruptly, or more slowly like a gradual erosion of safety margins.
With the economic pressure on companies, to act faster, cheaper, and better, safety is under pressure. This movement towards the margins of safe operation, where commercial market forces force companies towards states of increasing risks until events occur that lead to losses and disasters, was pointed out in the Normal Accident literature (e.g. Perrow, 1984), and the ‘drift to danger’ concept of Rasmussen (1997). To meet these threats recently in literature the term ‘resilience engineering’ was introduced (Hollnagel et al., 2006). Resilience refers to the ability of organisations to achieve primary goals under conditions of severe threats and disturbances. And safety is regarded as one of these primary goals. It requires a flexible adaptation to changing situations and pressures. And it requires the ability to create foresight, to anticipate on the changing shape of risk, before failure and harm occurs. In the bowtie presentation resilience is not only located in the right hand side, after a central event occurred, but also in the left hand side, before a central event occurs. Based upon the identification of critical equipment relevant accident scenarios must be identified, not only for the operational phase, but also for process disturbances, maintenance and emergency situations. How to create foresight is not an easy task, because efforts to improve safety of technological systems are almost always dominated by hindsight. The concern for safety, both in research and in practise, is predominantly driven by events that
7have happened, as is also shown on the results of the analysis of accident scenarios of mobile cranes.
The consequences of a dynamic approach for accident modelling andmanaging safety are not yet clear, but at least a reorientation on the concept of barriers is needed. Originally barriers were understood as physical things blocking paths of energy flows. In the bowtie presentation the barrier concept is already extended to primary barriers, hardware and human intervention, and managerial factors (Hale et al., 2006). Other authors make a distinction in procedural, immaterial and symbolic elements, in other words everything which keeps energy and information flows and processes in their desired pathways (Hollnagel, 2006). Feedback and feed forward loops are crucial to ensure effective functioning of barriers and safety management systems, but they have one major disadvantage. The presentations rapidly become so complex that potential users dismiss them as so much ‘spaghetti’ and plead for simple models they can see on the infamous ‘one sheet of A4’. These linear models will serve their purpose for simple accidents, but rapidly become inadequate in a complex environment.
There are some conceptual problems regarding resilience in organisations.
How resilience is recognised, and measured? Is safety performance a good indicator, are companies with high accident rates by definition not resilient (Hale and Heijer, 2006)? The keywords of resilience are foresight, flexibility, and adaptation under operational conditions. There can be quite a distance between the operational conditions as they go, and how management, rule and lawmakers imagine they go. Back to the building industry, and more specific hoisting activities, the question of resilience cannot be answered straight foreword. Regarding safety, the answer probably is negative, due to a jungle of rules and regulations, resulting at best in a compliance attitude of individual companies. But this does not mean these companies are not resilient in other areas, like their speed of production, or their survival in a competitive market, meaning there is hope.
REFERENCES
- 1. Ale B. Baksteen H. Bellamy L. Bloemhof A. Goossens, L. Hale A. Mud M. Oh J. Papazoglou I. Post J. Whiston J. (2008). Quantifying occupational risk: the development of an occupational risk model. Safety Science (46) 2, 176185
- 2. Aneziris O. Papazoglou I. Mud M. Damen M. Kuiper J. Baksteen H. Ale B. Bellamy L. Hale A. Bloemhoff A. Post J. Oh J. Towards risk assessment for crane activities Safety Science (in press) doi:10.1016/j.ssci2007.11.02
- 3. Bellamy L. Ale B. Whiston J. Mud M. Baksteen H. Hale A. Papazoglou I. Bloemhof A. Oh J. (2008). The software tool Storybuilder and the analysis of the horrible stories of occupational accidents. Safety Science (46) 2, 186197
- 4. CBS (2006). (Dutch Census Bureau). Every year about 100 fatal occupational accidents (in Dutch). Web magazine, http://www.cbs.nl/nl nl/menu/themas/mensmaatschappij/bevolking/publicaties/artikelen/2005 1804wm.htm, viewed April 13th
- 5. Guldenmund F. Hale A. Betten J. (2006). The development of an audit technique to assess the quality of safety barriers management. Journal of Hazardous Materials (130), 234241
- 6. Hale A. (2002). Conditions of occurrence of major and minor accidents. Urban myths, deviations and accident scenarios. Tijdschrift voor toegepaste Arbowetenschap (15), 3441 (in English)
- 7. Hale A. Ale B. Paas C Quik J. Mud M. Bellamy L. (2005). Using barrier concepts to understand priorities in the prevention of occupational accidents. In Krzysztof Katawrocki (Ed.), ESREL 2005. Advances in Safety and Reliability p. 775782, Balkema Publishers, Leiden
- 8. Hale A. Guldenmund F. Goossens L. (2006). Auditing resilience in risk control and safety management systems. In: Hollnagel E. Woods D. Leveson N. (2006). Resilience engineering. Concepts and precepts, Ashgate, Aldershot, UK
- 9. Hale A. Heijer T. (2006). Defining resilience. In: Hollnagel E. Woods D. Leveson N. (2006). Resilience engineering. Concepts and precepts, Ashgate, Aldershot, UK
- 10. Heinrich H. (1931). Industrial Accident Prevention. McGrawHill, New York
- 11. Hollnagel E. (2008). Risk + Barrier = Safety? Safety Science (46) 2, 221229
- 12. Hollnagel E. Woods D. Leveson N. (2006). Resilience engineering. Concepts and precepts, Ashgate, Aldershot, UK
- 13. JS Online (2006), Milwaukee Journal Sentinel, Accident at Miller Park, http://www2.jsonline.com/sports/brew/mpark/millerparklist.asp, viewed April 25th
- 14. King R. (2000). Brunelleschi’s Dome. Chatto & Windus, London
- 15. Macedo A. Silva I. (2005). Analysis of occupational accidents in Portugal between 1992 and 2001. Safety Science (43), 269286
- 16. Mud M. (2005). Modelling of occupational accidents in The Netherlands (in Dutch). NVVK Congress Good Practices, Eindhoven (www.veiligheidskunde.nl)
- 17. Mud M. Baksteen H. Ale B. Bellamy L. Bloemhof A. Hale A. Klein Hesselink J. Oh J. Whitehouse R. (2006). From Accident Stories to Bowtie Models. 3rd International Conference Working on Safety, The Netherlands (www.wos2006.nl)
- 18. Paas C. Swuste P. (2006). Mobile cranes, what goes wrong? (in Dutch). Journal of Applied Occupational Sciences (19) 3, 4755 (in Dutch). Also (in English): 3rd International Conference Working on Safety 2006, The Netherlands (www.wos2006.nl)
- 19. Perrow C (1984). Normal Accidents: living with high risktechnologies. Basic Books, New York
- 20. Rasmussen J. (1997). Risk management in a dynamic society: a modelling problem. Safety Science (27) 2/3. 183213
- 21. Reason J. (1990). Human error. Cambridge University Press, Cambridge
- 22. Reason J. (1997). Managing the risks of organisational accidents. Ashgate, Aldershot UK
- 23. Salminen S. Saari J. Saarela K. Räsänen T. (1992). Fatal and nonfatal occupational accidents: identical versus differential causation. Safety Science (15), 109118.
- 24. Saloniemi A. Oksanen H. (1998). Accidents and fatal accidents: some paradoxes. Safety Science (29), 5966.
- 25. Shannon H. Manning D. (1980). Differences between losttime and nonlost time industrial accidents. Journal of Occupational Accidents (2), 265272
- 26. Swuste, P. (2005). Safety analysis vertical transport mobile cranes (in Dutch) safety Science Group, Delft University of Technology, 56 pages. ISBN 906464 9766
- 27. Zemering C. Swuste P. (2005). The scenario audit. Proposal for a method to prevent incidents and disasters in the process industry (in Dutch). Tijdschrift voor toegepaste Arbowetenschap (18) 4, 7988
Papers relacionados