


 Manager The Center for the Professional Training and Development of Latino Workers Harry S. Truman College, Chicago, IL+ 1 773 907 3994 / dsanchez@ccc.edu
INTRODUCTION
INTRODUCTION
While the presence of a Latino workforce is well known in the United States, it is also very prominent in Europe. Spain, with its 14% immigrant workforce in 2007, ranks in the top word countries with largest immigrant populations percentage- wise. In the period 2000-2005, Spain was the second country on the world after USA in reception of immigrants and the first in rate of immigrants per nationals. Spain also has the largest Latino workforce in all Europe, and they represent almost the 50% of the country’s immigrant population. The Spanish government, following Europe Union policies, has developed a specific agenda to deal with the immigrant labor force regarding workplace safety issues. Different programs are managed by the Government, Labor Unions and other organizations to address against fatalities, injures and illnesses to these workers.
What educational background immigrants workers have in Spain? What types of jobs do they do? What are the work-related accidents they most commonly suffer? What types of preventive programs exists and what are their results? What types of barriers do they faced?
Keywords
Keywords
Immigration, workforce, statistics
OUTLINE
This presentation will be divided into three parts. The first part will present a study done by Mr. Iñigo Isasi and Mr. Antonio Corral from IKEI in May 2007 and published by The European Foundation for the Improvement of Living and Working Conditions, where it reflects the situation of Spain in regard the immigrant workforce and the Also, we want to interview these workers and know their point of view from the field regarding the aspects they are facing about safety at the workplace. (This part will be include during the presentation at the conference)
The second part will analyze the differences between the U.S. and Spain using the workplace related safety statistics, measures taken by both governments to diminish the work-related fatalities and accidents among immigrants. It is important to note that from the last statistics in both countries the immigrant workforce continue to disproportionately experience the highest rate in workplace accidents.
In the last section part, quoting Mr John Henshaw, OSHA administrator “One of the main ways of improve work safety is by communicating with employees in the language they understand.”, we will present the conclusions about a survey we did in 2006 over 500 Latino workers employed in the services, construction, and manufacturing industries of Chicago that shows the different aspects of the present status of workplace safety and health training they receive. We also want to show the results of a bilingual pilot program we delivered to 1000 Latino employees in the Chicago area.
Employment and working conditions of migrant workers – Spain
Iñigo Isasi and antonio Corral, IKEI, May 2007
Spain has traditionally been known as a country of emigrants. However, in the last decade, the country has experienced an unprecedented boom of immigration inflow. In this way, immigrant population has risen from 1.37% of the total population in 1996 to 8.75% at the beginning of 2006. Economic reasons are the main driver for the immigration process, resulting in a higher activity rates than nationals and thus a higher proportion of foreign working people (10.4% of total employed population in 2005). Sectors with the higher internal percentage of foreign workers include construction and agriculture, an also personal services, hotels and restaurant shave a significant presence. However, foreign workers have jobs of a worse quality than nationals (longer hours, lower wages, etc.) and they are in general less satisfied with their jobs than average. A problem of overeducation for the occupations held is rather widespread. On the other hand, illegal immigration is closely linked to work in the underground economy, with even worse working conditions.
Sources of information on migrant workers
Different sources of information have been used when preparing this contribution:
• The ‘Survey on Quality of Life in the Workplace’ (Encuesta de Calidad de Vida en el Trabajo), elaborated by the Spanish Ministry of Labor and Social Affairs. This statistical source provides information that can be brokedown by place of birth.
• The Labor Statistics Yearbook elaborated also by the Spanish Ministry of Labor and Social Affairs, which collects official information on accidents, contracts, etc.
• In addition to this the Spanish Labor Force Survey provides an accuratepicture of the Spanish labor market situation.• Finally, some ad-hoc studies on the issue have been used, which arequoted and mentioned throughout the report.
Information on migrant workers
Migrant population
Massive immigration is deeply changing the Spanish social and economic system. In fact, Spain has passed from being a country of ‘emigrants’ two generations ago to a country that is absorbing a huge inflow of people from abroad, basically for economic and employment reasons. Thus, the presence of foreign population in the country is becoming more and more prominent, which is generating an increasing public debate on the issue.
The number of foreigners rose considerably the since mid-nineties, and specially, in the last six years: the Spanish Population figures (provided by the Spanish Institute of Statistics, INE) show that in January 2006 there were 3,884,573 foreigners in Spain, which represented a 8.75% of the total population. Thus, the proportion of foreigners over the whole Spanish population has grown rapidly (see Table 1). If in 2002 foreign population did represent a 4.72% of the Spanish population, this percentage has increased to 7.02% in 2004 and 8.46% in 2005 (and 8.75% in
January 2006).
Due to this recent inflow, the personal profile of foreigners in Spain still corresponds to the first stadium of the migrant cycle, that is, mainly individuals who come on their own and will be followed by other derivative immigrants (family, friends, etc.). Thus, foreign population is mostly comprised by young adults between 25 and 44 years old, single or not accompanied by their couples, although this profile is likely to change in the near future. To give some data, the Spanish Institute of Statistics’s population figures show (at the beginning of 2006) that 53.45% of the current foreigners living in Spain are male and 46.55% female, with an average of 34 years old in both collectives. Moroccans have the lowest age average (28 years), while the British are the foreigners with a higher average age (52 years).
|
Table 1: Foreigners registered in the Spanish census according to sex, groups of age and nationality Table Layout |
|||||
|
2002 |
2003 |
2004 |
2005 |
2006 |
|
|
TOTAL POPULATION |
41,837,894 |
42,717,064 |
43,197,684 |
44,108,530 |
44,395,286 |
|
TOTAL FOREIGNERS |
1,977,946 |
2,664,168 |
3,034,326 |
3,730,610 |
3,884,573 |
|
SEX |
|||||
|
Male |
1,048,178 |
1,414,750 |
1,605,723 |
1,992,034 |
2,076,459 |
|
Female |
929,767 |
1,249418 |
1,428,603 |
1,738,576 |
1,808,114 |
|
AGE |
|||||
|
From 0 a 14 years |
259,625 |
364,575 |
440,957 |
528,713 |
542,214 |
|
From 15 to 29 years |
591,435 |
816,721 |
944,354 |
1,148,241 |
1,168,280 |
|
From 30 a 44 years |
683,201 |
915,366 |
1,042,853 |
1,298,029 |
1,352,956 |
|
From 44 to 64 years |
312,891 |
411,916 |
458,151 |
576,292 |
623,356 |
|
More than 64 years |
130,794 |
155,590 |
148,011 |
179,335 |
197,767 |
|
NATIONALITY |
|||||
|
European Community (1) Rest of Europe Africa Latin America North America Asia Oceania Not available |
489,813211,249423,045720,21232,35198,9421,746587 |
587,686348,585522,6821,032,12941,398128,9522,105631 |
636,037411,169579,3721,219,69342,726142,8281,920581 |
774,953577,300713,9741,422,87451,619186,8482,321721 |
916,113645,634741,5801,331,70144,709202,0832,160593 |
(1) From 2004 onwards, the European Community changes to EU-25
Source: Spanish Institute of Statistics, January 2002- January 2006. Elaboration: Ikei
Regarding the place of origin, foreigners come from no less than 30 nationalities which mainly belong to Latin America (34.28% of the total immigrants), the European Community (23.58%), Africa (19.09%) and the rest of Europe (16.62%). The past predominance of the Moroccan has been lessened by the intensification of the migratory flows from Latin America and the East of Europe, where all these groups come to Spain for economic reasons (find a job and a better living status).
In this way, Spain is attending a growing level of human diversity, where the largest country collectives at the beginning of 2006 were the Moroccan (535,009 individuals 13.77% of the total foreigners) and the Ecuatorian (399,585 people, 10.29%), followed by the Rumanian (9.83%), British (7.05%) and Colombian (6.14%). People from these five nationalities make up the 47% of the total amount of foreigners in Spain.
Immigration entails multiple consequences over the Spanish society and economy, which can be summarized in the following general overview:
• Demographic implications: Immigration has been the main reason for the growth of Spanish population in the last fifteen years. Between 1991 and 2001, immigration involved a 60% of the population growth and, since 2001, this contribution reaches a 90%, as stated by a report by the Foundation “1º de Mayo”, crated by the trade union CC.OO.. Besides, the constant arrival of young women coming from non-developed countriesassures a relevant contribution to the Spanish fertility rate. In fact, the number of Spanish births is experiencing an annual sustainable increase since 1997, while this figure did not stop diminishing during the previous two decades.• Economic implications: A report on Immigration and the Spanish Economy 1996-2006 elaborated by the Prime Minister’s Economic Office attributes to immigration a 50% of GDP growth during the last five years. This has implied an increase of 600 € in the per-capita income during the same period. The report of the Foundation 1º de Mayo also underlines immigration influence on consumption and employment increase, both engines of the Spanish economic growth. This has helped to establish a positive tax balance (also for the Social Security figures). However, it is argued that the Spanish growth model of the last years is based on more cheap and flexible employment (provided by immigrants) rather than a model based on productivity increases.• Social implications: Immigration entails social inequalities in Spain, since foreigners usually accept bad remunerated jobs, what implies a new subordinated class. Thus, whereas it has contributed to raise profits, it is likely to affect salary levels in a negative way. On the whole, it can be suspected that incomes are not being distributed equally, affecting negatively some concrete subgroups of immigrants (those linked with rural jobs). Additionally, there are increasing problems linked to the social integration of the immigrants.
Characteristics of the foreign working population
According to the data provided by the Spanish Labor Force Survey elaborated by the Spanish Institute of Statistics for 2005, approximately one out of ten workers (10,4%) in Spain comes from a foreign country, what is equal to an amount of 2,069,100 foreign workers (workers with double nationality are excluded from this figure). Regarding the characterisation of this collective (see Table 2), 57.4% of the foreign employees are male and 42.6% female, the presence of women being higher than the Spanish average (39.6%). By age, the largest group of Spanish foreign workers is between 25 and 44 years old (38.7%), followed by a 30% of foreigners between 35 to 44 years old. Interestingly enough, the foreign workforce is younger than the Spanish native one (33% of Spanish workers have more than 45 years old in comparison to 18% amongst foreign workers). Meanwhile, the largest share of foreign workers come from Latin America (up to 49% of the total), followed by non-EU European workers (19.8% of the total).
Interestingly also, the presence of an important immigration inflow for economic reasons implies that the activity rate of foreign workers is significantly higher than that of Spanish workers. Thus, and whereas foreign employees show an activity rate of 75.48% (year 2005), this rate is 55.6% in the case of the Spanish native workers. This difference is even wider when taking into account gender considerations (activity rate for foreign males is 84.86% in comparison to 67.18% for Spanish men, and 66.11% for foreign women in comparison to 44.52% amongst Spanish women).
|
Table 2: Employed Population according to age and sex, by nationality, 2005 Table Layout |
||||||||
|
Unit: People (thousands) |
TOTAL |
SPANISH Population |
FOREIGN Population |
|||||
|
Spanish |
Double Nationality |
TOTAL FOREIGN |
European Union |
Rest of Europe |
Latin America |
Rest of the World |
||
|
TOTAL EMPLOYED |
18,973.2 |
16,786.3 |
117.9 |
2,069.1 |
272.7 |
410.6 |
1,013.9 |
371.9 |
|
From 16 a 24 |
2,004.35,709.15,276.03,892.22,091.6 |
1,708.64,873.64,617.13,574.92,012.0 |
15.434.637.221.39.4 |
280.2801.0621.8296.070.1 |
19.482.387.558.025.5 |
68.9165.1108.561.07.2 |
148.1393.9305.9136.729.3 |
43.8159.7119.840.48.1 |
|
years From 25a 34 years From 35 a 44years From 45a 54 years 55 and more |
||||||||
|
years |
||||||||
|
MALE |
11,388.8 |
10,140.7 |
60.6 |
1,187.5 |
153.4 |
234.2 |
506.1 |
293.8 |
|
From 16 a 24 |
1,167.83,263.73,150.22,398.71,408.4 |
996.92,788.12,761.02,232.81,361.9 |
7.817.519.610.75.0 |
163.0458.2369.6155.141.5 |
10.548.546.931.116.4 |
36.295.562.137.03.4 |
83.3188.1163.455.715.5 |
33.0126.297.231.36.1 |
|
years From 25a 34 years From 35 a 44years From 45a 54 years 55 and more |
||||||||
|
years |
||||||||
|
FEMALE |
7,584.4 |
6,645.5 |
57.3 |
881.6 |
119.3 |
176.4 |
507.8 |
78.1 |
|
From 16 a 24 |
836.52,445.42,125.91,493.5683.1 |
711.72,085.51,856.11,342.1650.1 |
7.617.117.610.64.4 |
117.2342.8252.2140.828.6 |
8.933.940.626.89.0 |
32.769.646.424.03.8 |
64.8205.8142.580.913.8 |
10.833.522.79.12.0 |
|
years From 25a 34 years From 35 a 44years From 45a 54 years 55 and more |
||||||||
|
years |
Source: Spanish Labor Force Survey, 2005. Elaboration: Ikei
In addition to this, a research elaborated by FEDEA (Labor Market Assimilation of Immigrants in Spain: Employment at the Expense of Bad Job-Matches?) shows that foreign population’s unemployment rates are relatively similar to that of natives, although, again, important differences can be noticed by gender considerations (foreign males have an unemployment rate 2.2% points higher than that of Spaniards, while foreign females have it 3.5% points lower). Amongst foreigners, those coming from Non-EU European and Latin American countries show the lowest unemployment rates, while the opposite is true for those coming from Africa. Interestingly also, unemployment rates are lower for those foreign workers who have several years of residence in Spain.
Having in mind the previous figures, it is possible to identify several reasons explaining the current existing demand for foreign workers in the Spanish economy. These reasons are several, such as the fact that immigrants are occupying job positions scarcely attractive for the native Spanish workers or the opportunities opened for employers in a number of sectors, so immigrants are used to reduce costs (lower salaries, worse working conditions) and therefore higher profitability levels (see research conducted by FEDEA).
The distribution of foreign workers across sectors and occupations
From a sector perspective, the available data from the Spanish Labor Force Survey shows that the most usual sectors for foreign workers are tertiary activities (65.0% of the foreign total, specially in HORECA sectors and personal services), followed by a 17.3% in manufacturing activities, 12.4% in the construction and 5.3% in agriculture (data for 2005). Meanwhile, and from a relative perspective, the economic sectors with the higher internal percentage of foreign workers include construction and agriculture (18.7% and 15.0% of the total sector workers are foreigners, respectively) (see Table 3).
The proportion of men is noteworthy higher than women in all the sectors of activity, with the only exception of services where 64,1% of the foreign workers are female. Thus, the share of men in the manufacturing and primary sector almost multiplies by four that of the women, whereas in construction 97.9% of the foreign workers are male.
With respect to nationality, the presence of Latin American people is particularly important in the manufacturing and especially in the tertiary and construction sectors (37.9%, 54.4% and 47.3% of foreign workers come from Latin America, respectively). By way of contrast, primary activities show an important presence of foreign workers from a varied geographical origin (see also Table 1), although non- EU European workers are the main group.
|
Table 3: Employed Population according to nationality by sectors and sex Table Layout |
||||||||||||
|
Unit: People (thousands) |
Agriculture |
Industry |
Construction |
Services |
||||||||
|
Male |
Female |
TOTAL |
Male |
Female |
TOTAL |
Male |
Female |
TOTAL |
Male |
Female |
TOTAL |
|
|
TOTAL |
731.2 |
269.5 |
1,000.7 |
2,467.0 |
813,0 |
3,279.9 |
2,230.1 |
127.1 |
2,357.2 |
5,960.5 |
6,374.8 |
12,335.3 |
|
SPANISH POPULATION |
614.0 |
237.3 |
851.2 |
2,267.4 |
755.8 |
3,023.2 |
1,799.2 |
118.3 |
1,917.6 |
5,520.7 |
5,591.4 |
1,1112.1 |
|
Spanish Double |
612.9 |
236.8 |
849.6 |
2,257.9 |
752.1 |
3.010.0 |
1,785.5 |
117.5 |
1,903.1 |
5,484.4 |
5,539.1 |
11,023.5 |
|
Nationality |
1.1 |
0.5 |
1.6 |
9.5 |
3.7 |
13.2 |
13.7 |
0.8 |
14.5 |
36.3 |
52.3 |
88.6 |
|
FOREIGN POPULATION |
117.2 |
32.3 |
149.5 |
199.6 |
57.1 |
256.7 |
430.8 |
8.9 |
439.7 |
439.8 |
783.4 |
1,223.2 |
|
European Union Rest of Europe Latin America Rest of the World |
4.534.432.445.9 |
2.5 16.210.9 2.7 |
7,050.643.248.6 |
27,040.770.561.3 |
11.310.426.8 8.7 |
38.351.197.370.0 |
34.1101.0203.991.9 |
2.60.94.01.4 |
36.7101.9207.993.3 |
87.758.1199.494.7 |
103.0149.0466.2653.0 |
190.7207.0665.5160.0 |
Source: Survey on Active Population, 2005. Elaboration: Ikei
Interestingly also, it is worth stressing that there are important differences in the type of jobs carried out by the foreign population according to its geographical origin. Just to give some data, the majority (41%) of the non-EU foreign workers is concentrated on unqualified occupations (data for 2005 from the Spanish Labor Force Survey), while the predominant group amongst EU foreign workers correspond to scientists, intellectual technicians and professionals (with a share of 20.2%).
The contractual relations of migrants
According to the information provided by the Spanish Ministry of Labor and Social Affairs (in its Statistical Yearbook), the number of registered contracts to foreign workers has increased a positive 78.3% between 2003 and 2005 (from 1.5 million to 2.7 million) , clearly above the total average (17.0%). In fact, and taken into account the 2005 year, the share of contracts registered to foreigners in relation to the Spanish total has reached a peak of 16.0%, 2,745,243 contracts in total terms. By geographical origin, the largest share of contracts to foreigners corresponds to Latin America and Africa (38.6% and 28.9% of the 2005 contracts to foreigners come from these places respectively. Meanwhile, the five most important country origins (in terms of signed contracts) correspond to Morocco, Ecuador, Rumania, Colombia and Peru.
|
Table 4: Registered Contracts to Foreign Workers according to length of contract and working hours Table Layout |
||||
|
Working hours Length of contract |
2005 |
|||
|
TOTAL Contracts |
Foreign Contracts |
|||
|
Total |
Full-Time |
Part-Time |
||
|
Permanent Temporary |
1,542,83815,622,127 |
237,1782,508,065 |
160,4292,068,073 |
76,749439,992 |
|
Total |
17,164,965 |
2,745,243 |
2,228,502 |
516,741 |
Source: Statistical Yearbooks from the Ministry of Labor and Social Affairs, 2003- 2005
Interestingly also, contracts carried out with foreigners are mainly characterized by their temporary and full-time nature. Thus, and taking into account the 2005 data, 81.2% of the contracts to foreigners had a full-time basis, whereas the remaining 18.8% has a part-time nature. Meanwhile, 91.4% of the total contracts to foreigners had a temporary nature, in comparison to 8.6% share of permanent contracts, where this share is slightly lower than the Spanish average (9.0%) (see Table 4)
Working conditions of immigrants
• Sections of this report have mentioned how foreign workers (especially those from some concrete geographical origins) are particularly concentrated on specific unqualified occupations characterized by deficient working conditions, low remuneration level and temporary/seasonal nature. The ‘Survey on Quality of Life in the Workplace’ elaborated by the Ministry of Labor and Social Affairs provides information by place of birth of the workers, which can help to describe these situations.
• of all, the Survey confirms the unstable nature of foreign workersemployment, as percentages of the less secure contract formulas double those of native workers (i.e. temporary contract 12.2% against 6.6%, contract by work or service 16.5% against 8.5%, trial contract 3.7% against 1.3%, etc.).
Longer working days and low salaries are also characteristic amongst foreign workers, where irregular practices (no enrolment in the Social Security regime) are also typical for this group. Regarding working time, the data reveals that foreign personnel work in general more hours than the average. Thus the percentage of people working more than 41 hours a week is 41.6% amongst foreign workers against 32.5% of the Spanish average. Foreign workers also work more often overtime, at night and during week-ends (see table 5). Interestingly enough, the Survey shows how a greater proportion of non nationals are willing to work more hours in order to earn more money.
Regarding remuneration, the level of wages shows to be lower for foreign workers: 65.9% of them earn less than 1,205 euro/month, while 50.8% of the average is in that range.
With respect to physical conditions, according to the Survey the work of foreign people seems to involve physical effort more often than for the native personnel, but on the contrary it does not imply more stressful work or riskier conditions. This result somehow collides with some official data on work accidents, as foreign workers suffer relatively more accidents than native Spanish.
|
Table 5: Working conditions of foreign workers Table Layout |
||
|
Unit: vertical % of workers |
TOTAL Workers Average |
Foreign Workers |
|
Working time |
12.9 |
17.2 |
|
41 working hours or more |
||
|
Overtime (always/usually) |
3.9 |
8.3 |
|
At night (always) |
40.0 |
54.7 |
|
Weekend Willing to work more hours for more money |
25.8 |
37.3 |
|
Salary |
9.6 |
13.2 |
|
<600 € |
||
|
601–1,205 € |
41.2 |
52.7 |
|
1,206–2,105 € |
18.3 |
12.1 |
|
>2,106 € |
2.6 |
1.1 |
|
DK/NA |
27.4 |
20.2 |
|
Physical Conditions |
21.9 |
33.2 |
|
Physical Effort (always/usually) |
||
|
Risky Conditions (always/usually) |
12.9 |
13.5 |
|
Stressful Work (always/usually) |
28.6 |
26.9 |
|
Satisfaction rate (% of workers satisfied/very satisfied) |
50.9 |
42.0 |
|
With Work in general |
||
|
With salary |
51.7 |
46.1 |
|
With physical workplace |
79.0 |
71.0 |
|
With health/safety |
76.9 |
70.3 |
|
With working organization |
70.6 |
62.5 |
Source: Survey on Life Quality at Workplace, Spanish Ministry of Labor and Social Affairs, 2004
As a result, foreign workers tend to be less satisfied with their job than the rest, which applies to the work in general (42% satisfied/very satisfied against 50.9% average) as well as to salary, physical environment of the workplace, health and safety conditions or work organization.
According to the research conducted by FEDEA in 2006, the process of integration of the foreign workers in the Spanish labor market is quite different to that of the local native population. Thus, current immigrants enter the Spanish labor market via sectors of low qualification, characterized by a higher presence of temporary contracts in comparison to the national average. Interestingly also, the fact that around ¾ of the foreign labor force is concentrated on specific branches of activity (this is construction, agriculture, restaurant/food-industry and housework activities) characterized by worse working conditions explains also the general bad situation of foreign workers in comparison to native ones.
Level of education and occupational position: over-qualification and under- qualification
Over-education is another problem to be added to this precarious situation of immigrants.
According to the ‘Survey on Quality of Life in the Workplace’, in general, the education level of foreign employees is not lower than that of native ones (see table 6). In fact, more than a quarter of immigrant workers declare to have University studies, above the 22% percent of the average.
Table 6: Education and training of foreign workers
Table Layout
|
Unit: vertical % of workers |
TOTAL Workers Average |
Foreign Workers |
|
Education level |
3.0 |
3.8 |
|
Illiterate |
||
|
Primary studies |
16.0 |
12.6 |
|
Secondary studies |
36.0 |
41.7 |
|
Vocational studies |
18.5 |
9.9 |
|
University studies |
22.5 |
28.4 |
|
Training (% of total) |
17.4 |
32.4 |
|
Lower working status than education level Training |
||
|
activities offered in the company |
31.4 |
20.8 |
|
Participation in the training activities offered |
17.6 |
10.2 |
Source: Survey on Life Quality at Workplace, Spanish Ministry of Labor and Social Affairs, 2004
The Survey also shows that about one third of foreign worker performs a job with a working status which is inferior to their level of education, making it difficult any professional progress. Additionally, immigrants seem to have less access to training activities fostered by their companies.
On the other hand, the available information from Statistical Yearbook of the Spanish Ministry of Labor and Social Affairs shows that the largest share of contracts made to foreign workers corresponds to people with non-technical formation and low educational levels. Thus, a 66.4% of the foreign workers who signed a contract in 2004 had some kind of compulsory education up to the level of secondary studies, where a 14.9% had not even completed primary studies and 12.9% were illiterate. Compared to the previous information, these data reveals the existence of an important group of under-qualified immigrants that are repeatedly contracted on short-term temporary basis.
This question has a clear translation by nationalities, the lowest educational levels corresponding to foreign workers of Africa, whereas the highest education levels correspond to EU citizens and North Americans.
Summary
The Spanish labor market has experienced a dramatic change in the last fifteen years which is narrowly linked to a very important inflow of immigrants, mainly from Latin America, Northern Africa and Eastern Europe. Thus, 8.75% of the total Spanish population is currently of foreign origin, whereas a decade ago this percentage was of 1.37%. At least a 10.4% of the occupied population is of foreign origin, not including the underground economy, where important numbers of illegal immigrants work. This important inflow of people is having a number of deep consequences for the Spanish society and economy, basically in demographic terms (population growth), as well as economic and social implications (increase in GDP, consumption levels, positive effects on the tax balance, as well as wage restraint effects on some sectors). All in all, it is argued that the Spanish current growth model is largely based on an increase in cheap and flexible employment supply (mainly provided by immigrants) rather than a model based on productivity increases. In these sense, important problems regarding the labor (and social) integration of immigrants remain. Foreign workers are very often subject to unfavorable working conditions (low wages, longer working hours, work accidents, low category jobs for which they are overqualified, etc.). In these sense, the future sustainability of this model in the long run is subject to important uncertainties.
Inigo Isusi and Antonio Corral, IKEI
BIBLIOGRAPHY
• Arango J. “La Inmigración en España: Una Visión de Conjunto” (Immigration in Spain: a Broad Perspective), in: Fundación 1º de Mayo, Madrid, February 2006.
• Cachón L, “Inmigración y Mercado de Trabajo en España: Integración a
Través del Trabajo y Lucha contra la Discriminación” (Immigration and Labor Market in Spain: Integration by Means of Employment and Fighting against Discrimination), in: Fundación 1º de Mayo, Madrid, February 2006.
• Caixa Catalunya, Report on the Spanish Economy and the International Context, Barcelona, 1st semester of 2006.
• Fernández C & C Ortega, Labor Market Assimilation of Immigrants in Spain: Employment at the Expense of Bad Job-Matches?, in: FEDEA, Madrid, 2006.
• Spanish Institute of Statistics, Spanish Labor Force Survey 2005, Madrid.
• Spanish Institute of Statistics, Population Figures, Madrid, several years• Spanish Ministry of Labor and Social Affairs, Permanent Observatory of Immigration from the Spanish Secretariat for Immigration and Emigration, Statistical Yearbook of Foreigners 2003 and 2004, Madrid.• Spanish Ministry of Labor and Social Affairs, ‘Anuario de Estadísticas
Laborales’ (Statistical Yearbooks), several years, Madrid.
• Spanish Ministry of Labor and Social Affairs, Survey on Life Quality at Workplace, 2004, Madrid.
Employment and working conditions of migrant workers – USA
This brief Backgrounder provides a general picture of the number and socio- economic status of the nation’s immigrant or foreign-born population.The data was collected by the Census Bureau in March 2007 and published by The Center for Immigration Studies.
Among the report’s findings:
• The nation’s immigrant population reached a record of 37.9 million in 2007.
• Immigrants account for one in eight U.S. residents, the highest level in 80 years. In 1970 it was one in 21; in 1980 it was one in 16; and in 1990 it was one in 13.
• Since 2000, 10.3 million immigrants have arrived — the highest seven- year period of immigration in U.S. history.
• The largest increases in immigrants were in California, Florida, Texas, New Jersey, Illinois, Arizona, Virginia, Maryland, Washington, Georgia, North Carolina, and Pennsylvania.
• Of adult immigrants, 31 percent have not completed high school, compared to 8 percent of natives. Since 2000, immigration increased the number of workers without a high school diploma by 14 percent, and all other workers by 3 percent.
• The share of immigrants and natives who are college graduates is about the same. Immigrants were once much more likely than natives to be college graduates.
• The primary reason for the high rates of immigrant poverty, lack of health insurance, and welfare use is their low education levels, not their legal status or an unwillingness to work.
• Immigrants and natives have similar rates of entrepreneurship — 13 percent of natives and 11 percent of immigrants are self-employed.
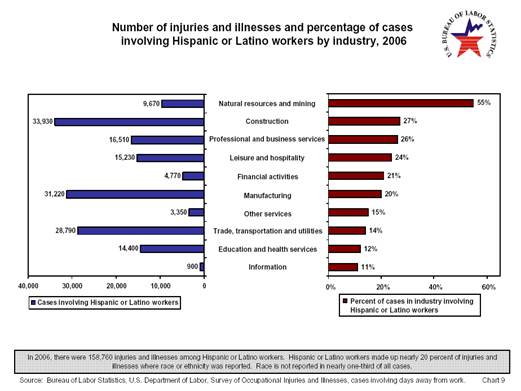
Rate of fatalities, injuries and accidents involving Hispanic or Latino workers. (USA data Dec 2006)
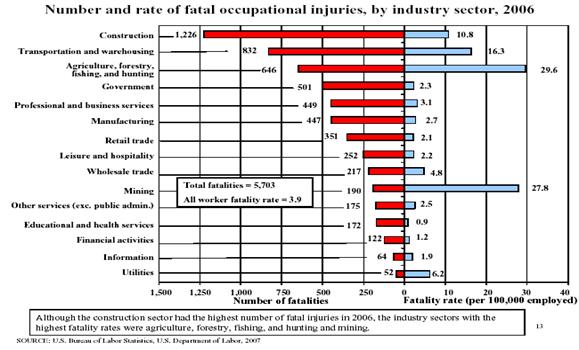
In 2006, 937 Hispanic workers were fatally injured while at work, a new series high. This figure is up 1 percent from 923 fatalities in 2005 and represented the largest annual total since the fatality census began in 1992. Due to increased employment, however, the fatality rate for Hispanic or Latino workers was slightly low (4.7 fatalities per 100,000 workers in 2006 versus 4.9 per 100,000 in 2005). But Hispanic worker fatalities accounted for 16 percent of the 5,703 total fatal work injuries that occurred in the U.S. in 2006.
Fatalities among White workers, Black or African-American workers, and Asian, Native Hawaiian, or Pacific Islander workers were all lower.
In conclusion meanwhile the overall fatal work injury rates for the U.S. in 2006 was lower (3.9 per 100,000 workers) than the rate for any year since the fatality census was first conducted in 1992; Latino workers represented the largest annual total since the fatality census began.
Rate of fatalities, injuries and accidents involving Hispanic or Latino workers. (Spain data Dec 2006)
In 2004 the government of Spain started gathering data about the nationality of workers who suffer any injury, accident or death at the work place.
In 2006, 11.5% of the workers that died at the workplace were foreign workers and 3.6% of them were Latinos. The fatality rate for Latino workers was 4.95 per 100,000 workers; being 7.5 for all foreign workers and 6.1 for all workers.
Regarding accidents with days away from work, 911,561 cases was the total for the whole Spanish workforce in 2006 which 108,041 (12%) of them were foreign workers, and 5% were Latinos.
The charts below showing the results from 2004-2006120.00%
100.00%97.54%96.31%94.92%
80.00%
60.00%
Latino workers all workers
40.00%
20.00%
0.00%
2.46% 3.69% 5.08%
2004 2005 2006

% of accidents involving days away from work
 |
|
70.00%60.00% |
61.70
% 58% 57.30%
50.00%
40.00%
30.00%
38.70%
42.00%
42.70%
All foreing born workers latino workers
20.00%
10.00%
0.00%
2004 2005 2006
number of fatal injuries
120
100
80
6040 54 29
74 other foreing-born Latino workers
20 33 3517
-2004 2005 2006
Rate of accidents per 100,000 workers 2006
 |
18,000.0016,000.0014,000.0012,000.0010,000.008,000.006,000.004,000.002,000.00 |
0.00
![]()


 |
|
foreing-born workersall workers |
Conclusions
 |
|
• Spain is facing the immigration issue in a very short period of time. That’s why they are not enough studies or evidences that can give us a clear path on how immigrants are doing regarding safety at the workplace. • The tendency in these three years where we have data shows that the immigrant workforce as a whole, starts showing higher rates in fatalities and accidents at the workplace than the Spain-born workforce. • If we compare the rates of accidents between Latinos and others foreign-born workers, we see that even tough the Latino workforce in Spain is bigger than the rest of immigrant workforce, they have less cases ofaccidents. One more time and similar to the USA results we can conclude that the barrier language among immigrants is a very important factor in regard with the number of accidents and death suffered by this group at the workplace.• Regarding which sectors immigrants have more accidents, we can see a rare case in construction. Despite the construction industry has the largest number of immigrant workforce; the rate of accidents is lower than for Spain-born workers. The justification can be the level of education workers have. A study made by La Fundacion Laboral para la Construcción, Spain 2005, showed that immigrants working in the construction industry had higher educational level that Spaniard working in that sector.• However the manufacture sector shows that immigrants suffer 35% more cases with accidents than the Spain-born workers. |
Spain Government’s Efforts to Address the Workplace Safety Issues Faced by the Immigrant Labor Force
The increasing presence of foreign workers in the Spanish labor market is generating a growing discussion about migration in the Spanish society, attracting the attention of policy-makers and social partners about the best way to successfully manage this new challenge. In this sense, the two most important Spanish trade unions (CCOO and UGT) are developing a number of specific actions aimed at fostering working conditions and affiliate figures amongst foreign workers. Thus, and on the one hand, CCOO is currently carrying out an important effort to increase the number of affiliates amongst migrant workers where, at the same time, has developed a specific route in its web page specifically aimed at this group of people (where information about laws and other relevant information can be found). On the other hand, UGT has also developed a concrete domain for foreign workers in its webpage. In addition, UGT publishes on a periodical basis comprehensive information related to regulations, guides for foreigners, a catalogue of high demand occupations, lists of interesting addresses, etc. Very interestingly, UGT has participated in a project intended to establish mechanisms and structures to provide an effective management of labor migration movements in both origin and host countries, helping also to prevent and combat irregular labor migration, promote social and labor integration/inclusion of migrants and, finally, protect foreign workers' labor rights. This project has been signed between UGT and CTC (a Colombian Trade Union) and the Ecuadorian Ministry of Labor and Foreign Affairs.
In addition to the activities carried out by the Spanish trade unions, public authorities also promote different actions for supporting and advising foreign workers. In this sense, the Spanish Government has recently presented a draft for the Strategic Plan of Citizenship and Integration for the period 2006-2009. Interesting also, the National Forum for Social Integration of Immigrants, created in 1994, and belonging to the Spanish Ministry of Labor and Social Affairs (by means of the Secretariat of Emigration and Immigration), pursues the participation and integration of foreigners legally established in Spain.
Not only at national level but also at regional and local level, projects of this nature have been set up since 2001 onwards, focused on the integration of foreigners. Some examples include the II Plan for Immigration in Andalusia 2005-2009, the Plan for Social Integration of Immigrants from the region of Murcia (2002-2004) or the Canarian Plan for Immigration 2005-2007. Likewise, there exist several NGOs and immigrants associations whose main goal is to successfully integrateimmigrants into the Spanish society. Relevant examples include CEAR (Spanish Commission for helping the Refugee), COMRADE (Committee for Defense of Refugees and Immigrants in Spain), OMI (Multicultural Organisation providing Services for Integration of Immigrants in Catalunya and the world), the Federation of Associations of SOS Racism.
USA Government’s Efforts to Address the Workplace Safety Issues Faced by the Latino Labor Force
Source OSHA. OSHA has mounted a significant effort to reach out Spanish-speaking workers and their employers. The agency formed a special task force in October 2001 to examine the issue of rising Hispanic worker fatalities and what it should do to address the problem. The task force is looking at three areas: sharing best practices, expanding outreach, and determining where more information is necessary.
OSHA´s current outreach efforts to the Latino worker community include:
• New Spanish language page on OSHA’s website.
• New Spanish language option on OSHA’s 1-800 number.
• Numerous Spanish translation and new publication.
• Spanish version of the 10-hours construction training delivered regularly in Texas.
• Collaborative effort working with the Catholic Church in New York.
• CARE (Construction Accident Reduction Emphasis) program in Atlanta with special focus on reducing Latino fatalities.
• Liaison with the Mexican Consulate in several cities.
• National alliance with Latino Contractors of America.
• Working arrangements with police and emergency responders to notify OSHA when fatalities occur in case others do not.
• Participation in new Texas Justice and Equality in the Workplace Program, first of its kind to protect rights and promote safety of Latino workers.
• Co-sponsorship and participation at the Hispanic Chamber of Commerce meeting in 2001.
• Susan Harwood grants awarded Hispanic outreach programs in Alabama,
Arizona, Pennsylvania, Texas, Maryland, and California.
• Radio and television public services announcement in Spanish about safety issues.
• Active recruitment of Spanish speaking employees to add to the 180 whoalready work for OSHA.• Use of focus groups to determine how best to reach Spanish speaking workers and their employers with job safety and health information.• Collection of new data when investigating fatalities to determine the role language and country of origin play in accidents.
State of Illinois: Panel on Latino Workforce Injuries and Fatalities.
September 2005
Concerned about the high and increasing rate among immigrant Latino workers, the Governor Office from the state of Illinois appointed a panel of government officials, local community advocates, union representatives, and occupational health specialists to develop recommendations to improve the job safety for Illinois´Latino workers.
The top five recommendations included:
• Create a worker safety fund to support a collaborative outreach to the Latino workers, developing workers safety materials in Spanish and providing health and safety training in Spanish.
• Relocate the on-site safety and health consultation team to the Departmentof Labor• Strengthen and amend the existing Day Labor Act• Coordinate a statewide data collection system to help centralize and analyze occupational injury, illness and fatality data.• Support further reforms to the Illinois Workers´Compensation Act.
Present Training Methodologies and their Effectiveness
In this section, we present the conclusion of a survey we did in 2006 to shed light on the on different aspects of the present status of workplace safety and health training for the Latino labor force of Chicago. Among other things, we were interested in finding out about the prevalence of workplace safety and health training, the training methodologies being used with Latino workers, and the effectiveness of those methodologies.
The workers surveyed were older than 18 years old and include both males and females with the important characteristics that they were born outside of the U.S. These workers came from different companies or unemployed looking for job with the same issue, they lack the English skills. The reason for choosing this population is because, as the statistics have reflected, this Latino population is the most vulnerable regarding workplace safety.
Conclusions
• The general knowledge is very poor both for trained and not trained workers.
• Trained employees were more successful in demonstrating a basic knowledge of workplace safety and health concepts. However, they do not demonstrate to be significantly more knowledgeable than those that have not received training. For that reason, it can be inferred that the training methodologies being used are not effective. Lees than 50% of employees trained had been heard about OSHA.
• Also, employees that have not received training are better able to identifytheir workplace risks. This might mean that during training there is not enough guidance about risk detection and prevention.• It is understandable that service employees are not familiarized withlockout/tagout processes because they do not apply to them but only 21% of the manufacturing trained employees knew about Lockout tagout procedure.• It can be concluded the knowledge about work related illnesses is very low.• Even though the basic knowledge of workplace safety and health is very low for all the groups, it is evident that the most effective methodologies were those that delivered the training in Spanish of bilingually.• It is important to notice that 48 % of the employees that received training in
Spanish went through an oral presentation but did not receive training materials in Spanish. Of those that received bilingual training, 42 % received bilingual training by means of a translator without obtaining any type of handouts in English or Spanish.
Bilingual Education is Vital
The Center for the Professional Training and Development of Latino Workers was awarded on 2006 with a grant from the Department of Labor to develop and deliver a bilingual training focus on how to prevent amputations at work addressed to 1000 Spanish speaker employees.
Below we show the results of this program.
Safety 1000 "Prevention of Workplace: Amputation Hazards" Employees' Training Evaluation Chart (54 courses)
FY 2007
100%

95%
90%
89% 89%
92% 92%
90%
91%
89% 89%
88%
85%

80%
82%
84%
81%
75%
70%
65%
60%
55%
50%
Clear Presentation of Course Content
Course Content Course Length Course Subject
Sequence
Facilitator Know ledge of Subject
Facilitator's Preparation
Facilities Facilitator's Enthusiasm
Question Answ er by Instructor Adequately
Workshop Materials
Overall Rating Grand Total
Safety 1000 "Prevention of Workplace: Amputation Hazards" Average Pre and Post Assessments (54 courses)
FY 2007
100
 |
|
90 80 7670 |
60
|
5040 30 182010 |
0
1 6 11 16
2
1 26 31 36
Number of Trainings
41 46 51 AVERAGE
Pre Assessment Post Assessment
Safety 1000 "Prevention of Workplace: Amputation Hazards" Employees' Follow-Up Chart - (149 participants)
FY 2007
100
 |
|
90 |
81
79
80
70
60
50
40
40
30
20
10
0
![]()
![]()
![]()
![]()
![]()
![]()
![]()
|
Dehler Manufacturing Infinity Service Management |
Open Enrollment Open Enrollment Open Enrollment Open Enrollment Nation Pizza
Products
Otto & Sons AVERAGE
Average of Pre Assessment Average of Post Assessment Average of Follow-up
Safety 1000 "Prevention of Workplace: Amputation Hazards" Supervisors' Follow-Up Chart - (28 participants)
FY 2007
100% 100%

100%
93%
90%
80%
72%
70%
64%
64%
60%
52%
50%
|
40% 30% 20% 10% |
0%
You have received some kind of
You have noticed some change of
Safety is a priority at your company
You have found positive the safety
You consider positive to teach
The company has projected some
You have other training needs for
suggestions
attitude from your
training your
safety in Spanish to changes regarding
your employess
regarding safety issues from your employees
employees
regarding safety issues
employees received Spanish speakers
employees
safety issues
Conclusions:
• The quality of the 54 programs gave an average of 88% of approval over 11 items.
• The pre assessment score average for the 54 programs was 18% and the post assessment score average rose up to 78%.
• The retention three months after the training gave a 78% of knowledge.
• 100% of supervisors interviewed after training said they considered very useful the training received per their employees.
• 100% of supervisors interviewed after training said they considered very positive teach safety in Spanish to Latino workers.
Papers relacionados