


Palukka, Pertti
Occupational Safety Engineering / Tampere University of Technology/ Korkeakoulunk. 4, PB 541 / 33101 Tampere, Finland 358 3 3115 2587 / Pertti.Palukka@tut.fi
ABSTRACT
The number of occupational accidents has stayed relatively the same during recent years in Finland. The aim of the study was to get an overall picture of accidents at work in 2001 and to find weaknesses on which to focus prevention. The accident incidence rate in construction has been high, like in manufacture of metals: the younger the age group, the higher the accident incidence rate. As a conclusion: first, it is important to ensure sufficient knowledge of accident prevention both in vocational and university education. Second, skills and knowledge of the youngest age group must be given special attention in training at workplaces.
Keywords
Accidents at work, accidents frequency, accident incident rate, prevention, construction and manufacture of metals
INTRODUCTION
This study belongs to the occupational accident prevention programme 2001-2005. The objective of the programme is to steadily reduce the number and seriousness of occupational accidents in Finland. The core idea of the programme is to promote the adoption of a high-standard of safety culture and the ‘vision zero’ concept in all sectors of Finnish working life.
The aim of the study was to get an overall picture of accidents at work in 2001 and to find weak- nesses on which to focus prevention. In this study, stock is taken of the accident situation at the beginning of the programme in order to decide on development and compare it with the result/situation at the end of the programme.
The figures are based on the data of the Federation of Accident Insurance Institutions (FAII) which collects data on at accidents occurring all types of workplaces. As a rule, the statistics focus only on the occupational accidents causing disabilities lasting over three days. This paper concerns accidents at work in construction work and the manufacture of metals1.
Table 1 presents the numbers and percentages of industry employees between ages 15 to 24 and 25 to 34-years. The proportion of the employees 15 to 24 years old is 8 % in
1 Manufacture of metals contains the following branches: manufactore of machinery and equipment; manufacture of basic metals, fabricated metal products, office machinery and computers, electrical machinery and apparatus, radio, television and communication equipment and apparatus, medical, precision and optical instruments, watches and clocks, motor vehicles, trailers and semi-trailers, other transport equipment and building of ships and boats.
construction and 10 % in manufacture of metals, while the proportion of those 25 to 34 year olds is 28%.
Table 1. Numbers and percentages of employees in industry in 2001.
15-24 years old 25-34 years old
Total
Number of industry Number of industry of industry Construction 8456 8 25841 23 111252 Manufacture of metals 19158 10 52908 28 185655
% of employees
% of employees
employees
ACCIDENTS AT WORK 1993-2001
The number of occupational accidents has stayed relatively the same during recent years in Finland. In 2001 there occurred nearly 122 000 accidents at work. These do not include farmers’ accidents. Direct costs are approximately 500 million euros per year, while accidents at work and occupational diseases caused a cost of about 3.5 billion € to the national economy, being nearly 2.5 % of GDP. There were nearly 103 000 primary occupational accidents. There happened 48 fatal occupational accidents on average every year from 1993 to 2001.
In 2001, men had nearly 85 000 occupational accidents and women over 36 000. The proportion of accidents which happened to women compared to the proportion of all occupational accidents has been 30 % nearly every year from 1993 to 2001. Men's accident incidence rate has varied on both sides of 70, and among women it has been between 32 and 35.
140000

120000
 |
|
100000 80000 |
60000 ![]()
40000
20000
0
1993 1994 1995 1996 1997 1998 1999 2000 2001
Figure 1. Employees’ accidents at work by gender in 1993-2001.
Accidents at work in construction and in manufacture of metals
In the following diagrams, there are figures depicting the situation of occupational accidents in 1997-2001 (Figures 2 and 3) The diagrams depict on a semilogarithmic scale the numbers of accidents which happened at workplaces, in commuting and to drivers while at work in both fields of industry. In construction there occurred in 2001 nearly 17 000 accidents at work, the number of which has been on the increase to some extent. The corresponding number was over 19 000 in manufacture of metals.
100000
Construction
100000
Manufacture of metals
10000
 |
|
1000 100 |
10000

 1000
1000
100
10 10
1
1997 1998 1999 2000 2001
1
1997 1998 1999 2000 2001
Figure 2. Number of accidents in construction Figure 3. Number of accidents in manufac-ture of metals
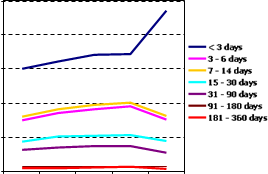
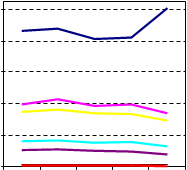
According to the study, the number of very long absences from work (over one month) due to serious work accidents has stayed nearly the same from 1997 to 2001 in both industries studied, while the number of absences of less than 3 days has increased in construction and manufacture of metals (Figures 4 and 5).
10000
Construction
10000
Manufacture of metals
8000

8000

 |
|
6000 6000 4000 4000 2000 2000 0 |
1997 1998 1999 2000 2001
0
1997 1998 1999 2000 2001
Figure 4. Number of incidents by length of disability in construction
Figure 5.Number of incidents by length of disability in manufacture of metals.
Accident incidence rate and accident frequency
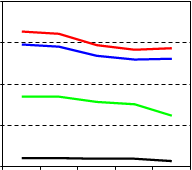
Figures 6 and 7 present the accident frequency and the accident incidence rate in both industries. Accident frequency refers to the relation between the accidents which occurred and the hours worked. The relation is calculated per one million hours worked. The accident incidence rate refers to the relation between the accidents which occurred and the number of employees. With regard to accidents leading to disabilities of more than three days, the ratio has been calculated per 1000 employees.
The accident frequency of both industries has stayed nearly the same although there has been a small overall decrease (Figures 6 and 7). The accident frequency in construction industry has been high, like in manufacture of metals. However in manufacture of metals the accident frequency has decreased from 90 to 78 accidents. Also the frequency of serious accidents and absences of at least 3 days have decreased. In construction industry the accident incidence rate has been on the increase, while accident frequency has declined. The differing development in accident incidence rates and frequencies reflects the changes in working procedures and practice in construction, which have resulted in longer working days and a decrease in the number of employees.
150
Construction
120
Manufacture of metals
120
 |
|
90 90 60 60 30 30 0 |
1997 1998 1999 2000 2001
0
1997 1998 1999 2000 2001
Figure 6. Accident frequency and accident incident rate in construction
Figure 7. Accident frequency and accident incident rate in manufacture of metals
When the accident incidence rate is being studied according to the age group (15 to 24, 25 to 34 years old), the highest accident incidence rate (185) are in the youngest group in construction and manufacture of metals (135) in 2001: the younger the age group, the higher the accident incidence rate (Figures 8 and 9). In both industries the accident incidence rate of the youngest age group has been nearly double compared to that of the oldest age group.
240
Construction
160
Manufacture of metals
200

Papers relacionados