


Introduction
An organization’s digital workplace is the collection of company-provided digital applications and systems that employees use to do their jobs [3]. Many companies take technology driven investment decisions and overlook the users of their digital workplaces [17]. Critical for user work on a digital workplace is his/her experience – how the user interacts with a system, positively or negatively, in the digital workplace [3]. User experience describes the whole impact a workplace has on the user. The timeline goes from before, while and after workplace use [15]. This experience includes usability, cognitive, socio-cognitive and emotional aspects of users’ experience in their interaction with the workplace, such as users’ enjoyment, aesthetic experience, desire to repeat use, positive decision to use a digital workplace and enhanced mental models [3]. The poor user experience can be the cause of reduced productivity and user work satisfaction. A major area of research is how a positive ‘user experience’ of the use of digital workplaces can be promoted [5].
Companies have long been concerned with users in workplace design, but the emphasis has been on the ergonomic aspects [16]. User experience goes beyond ergonomic aspects to encompass affective aspects concerning how to elicit desirable emotional responses from users. Positive emotions and pleasant experience in the workplace can help employees to reach better performance, job enrichment, higher quality social context and prevent fatigue [2]. Negative emotions such as stress, fear, sadness, anger, hostility, and guilt accumulated at work can decrease the workplace user performance and health [2], [20].
Personalization can support employees to reconfigure their workplaces, allowing them to shape their work experience and suit their work process [14]. The personalization of workplace UX can positively influence the workplace productivity. The companies should tackle such issues by looking at digital workplace through UX lens.
From a holistic perspective, there is a need to study user experience design incorporating the emotional dimension, the ergonomic dimension, and the personalization dimension in the context of digital workplace [20].
A multitude of methods for UX design and evaluation exist [18] but there are development needs for UX evaluation method including emotional and personalization workplace UX [15]. Measuring the user experience provides the quantitative analysis of data gathered on the digital workplace [1]. User experience manifests as quality in design with diverse measures from many methods and instruments. The UX measures enable to determine appropriate design options for the digital workplace. One of the challenges related to UX is how to select appropriate measures to address the particularities of an assessment context which is especially important as a basis for creating design guidance [5].
There are a lot of approaches for UX assessment of digital workplaces [8], [16], [10], [11], but for big sized companies with a lot of workplaces it is difficult to study all of the workplaces [13]. There is a need of an approach for systematic UX assessment of whole companies and allocation of departments with poor UX for further detailed study [12]. Also there is a need of an approach to support detailed digital workplace design aimed at meeting and adapting to user expectations and at creation of positive emotions during working on the workplace.
A UX-oriented methodology for measuring and designing digital workplaces is presented. Two checklists guiding UX assessment and design are developed. They include emotional and personalization UX dimensions. This methodology allocates UX problems, proposes their solutions, and generates recommendations for UX design of digital workplaces with the aim to provide points of reference for designers.
Methodology
A methodology is proposed to drive digital workplace design for user experience. It has 12 consecutive steps shown on Fig. 1. At step 1 of the methodology a checklist for quick UX assessment of digital workplaces in a company is designed (cf. Figures 2 and 3). For this purpose a checklist of nine dimensions measured by 15 questions (cf. Fig. 2) is developed. For example, for assessment of checklist dimension environment (D6) two questions shown in Table 1 are used (cf. Fig.3). At step 2 data is gathered using this checklist [8], [16]. At steps 3 and 4 a quick UX assessment of company digital workplaces and clustering of most risky company departments is carried out. UX assessment aims at identifying UX-related weaknesses of workplaces. The entire construct of workplace UX can be represented by a single quantitative dependent variable: UX index. It is a measure of how closely the features of a workplace match generally accepted UX design guidelines. For UX assessment an UX index is determined (cf. Fig. 2). For calculation of this index, a honey bee-based neuro-swarm optimization algorithm is developed [9], [19], [10], [11]. It aggregates nine workplace UX dimensions measured by 15 checklist items/questions. The checklist structure is represented as an artificial neural network. By a modification of the neuro-swarm artificial bee colony algorithm neural network weights are trained using as a target the emotional workplace UX (checklist dimension D9). Using these weights the responses of workplace users are aggregated to UX indices. Based on UX indices, critical departments and workplaces with bad and moderate UX can be found from a workplace UX viewpoint (cf. Table 1).
During step 5 a detailed checklist with dimensions of workplace UX including emotional UX and personalized UX (cf. Figures 4 and 5) are defined [8], [16]. At step 6 data using the detailed checklist is collected. At step 7 detailed UX indices for each checklist dimension (cf. Fig. 4) are calculated. Based on these indices at step 8 workplaces with bad and very bad UX are allocated and relevant low-cost measures [12] for its improvement are recommended. For example, the appropriate use of digital workstations can help in reduction of physical discomfort arising from using computers for long hours which is achieved by adjusting the seating and the operator's posture, then adjusting the relation of the user to the keyboard and the screen. At step 9 these measures are implemented. At step 10 effects of these measures on UX are measured and compared with previous UX levels. At step 11 optimal corrective measures are implemented. Finally at step 12 long-term solutions to UX problems in the form of standardized workplaces are designed. They enable individual adaptation (personalization) to different users support them to reconfigure their workplaces, and allowing them to shape their work experience and suit their work process.

Figure 1. Methodology steps
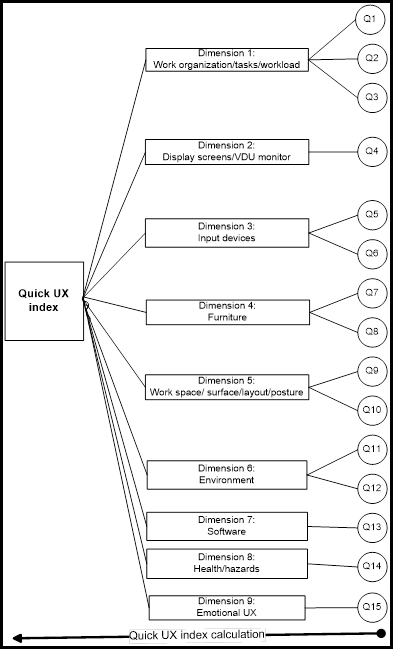
Figure 2. Quick UX assessment model
![]()
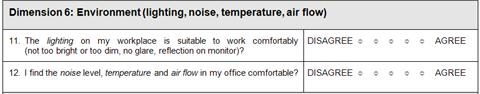
Figure 3. Sample questions for assessment checklist dimension environment (D6)
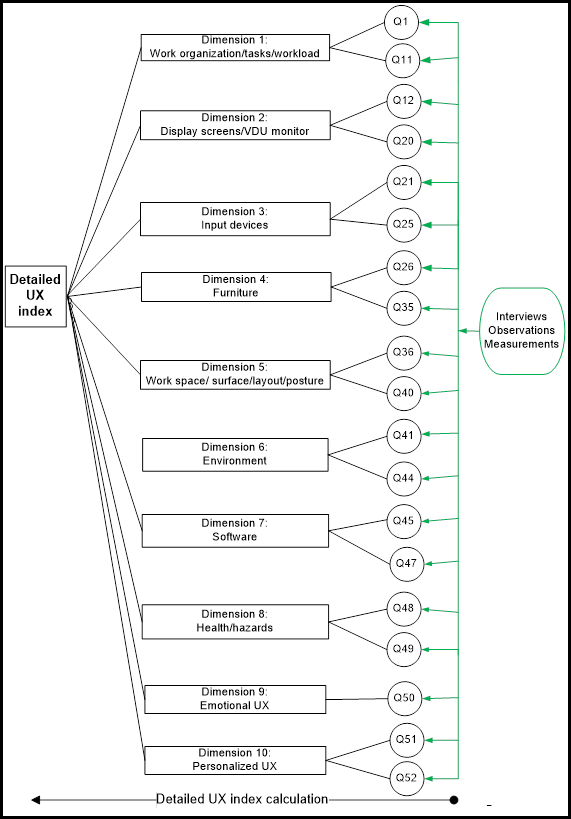
Figure 4. Detailed UX assessment model
![]()
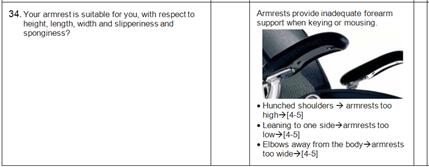
Figure 5. Sample question for assessment of checklist dimension furniture (D4)
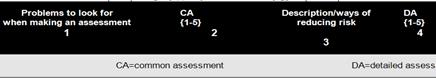
Table 1. Scale for UX assessment
|
Rating |
Index range [1,5] |
Index range [0,100] |
Color |
|
Good UX |
|
|
|
|
Moderate UX |
|
(25,50] |
|
|
Bad UX |
|
(50,75] |
|
|
Very bad UX |
|
(75,100] |
|
Case Study
For illustration and validation of the methodology proposed data from a company with digital workplaces by using the online checklist of 15 questions was collected. At step 2 we collected data from 212 workplaces and allocated departments and workplaces with bad and moderate UX. At step 6 we studied 91 workplaces selected at step 4. We collected UX data by detailed checklist at these workplaces, analyzed the data and proposed low-cost corrective measures applying our methodology (cf. Figure 1).
The worst UX for the company's departments are health/hazards (D8=0.28) caused by bad display screens (D2=0.25), input devices (D3=0.14) and workspace layout (D5=0.14). Company departments with bad and very bad UX level were screened for further detailed study. Six departments were not studied which significantly reduced the efforts, time and costs of UX study.
According to methodology step 8 we had to implement the corrective measures on all 91 workplaces studied at steps 6 and 7. When we started our implementation only 40 out of 91 workstations were with the same employees (44%). This was because of turnover, workplace rotation, etc.
For each workplace UX before and after implementation for 8 dimensions (cf. Figure 4), the total UX risk and the UX improvement after implementation were determined. With red color are indicated very bad UX according to Table 1. For each employee the total UX level is indicated using the colors from Table 1. For example the total UX level for the digital workplace shown on Fig. 9 from 67% (yellow) after implementation of low-cost corrective measures was improved to 50% (light green), i.e. 25% UX improvement. The corrective implementation measures for the workplace shown on Fig. 9 are the following: user trained for workplace set-up; laptop moved to right of desktop computer; provided wristrest and keyboard and mouse pad; desktop computer with arm, keyboard and mouse adjusted in front of user; phone moved to left on tray; chair/armrests/seatpan adjusted; calculator connected to power and adjusted horizontally; DVI cable connected to second desktop computer to docking station; laptop moved under phone tray; adjusted second desktop computer; cables adjusted under user desk.
On Figure 6 the UX levels before and after implementation of low-cost corrective measures at 40 workplaces are summarized. The worst UX level for all workplaces was connected with keyboard and mouse (69%). After providing wristrest for keyboard, mouse pad and adjustment of input devices the UX risk was reduced to 36%. The initial UX level caused by chair (50%) after adjustment of chair was improved to 31%. The UX level connected with bad allocation of monitors (41%) after their rearrangement in the front of user and adjustment was improved to 26%. Usually the laptop monitors were too low and it was not possible to raise them. The UX level for dimension work organization was improved from 37% to 35% by training of staff how to adjust ergonomically their workstation. By introduction of panels and trays and rearrangement of worksurface, as well as adjustment of cables under desk the workspace UX risk was reduced from 29% to 18%. A significant UX improvement of health hazards risk by a minimum of 20% within 1-3 months is expected after implementation of these low-cost corrective measures. The total relative UX level was improved by 32% (cf. Figure 7). The highest UX improvement was for input devices keyboard and mouse (48%) followed by furniture 38%, workspace (38%) and monitors (37%). At last step 12 further UX improvement by standardized UX optimized workplaces design was planned.
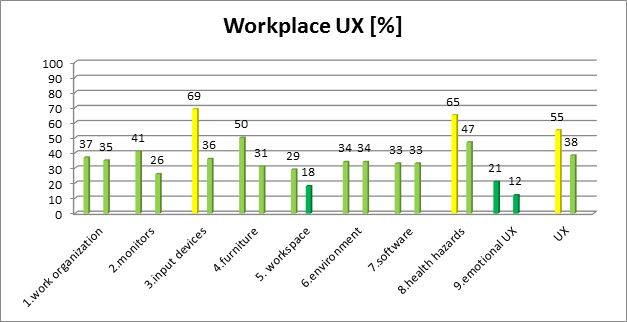
Figure 6. Bar chart summarizing workplace UX [%] before and after implementation at 40 workplaces
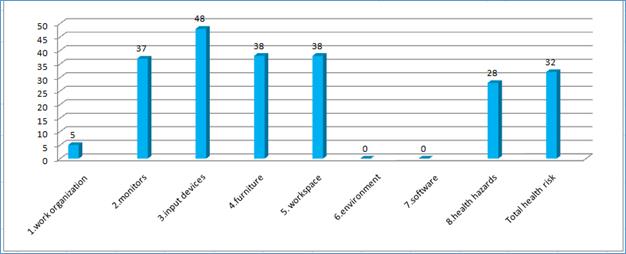
Figure 7: UX improvement [%] after implementation of corrective low-cost measures
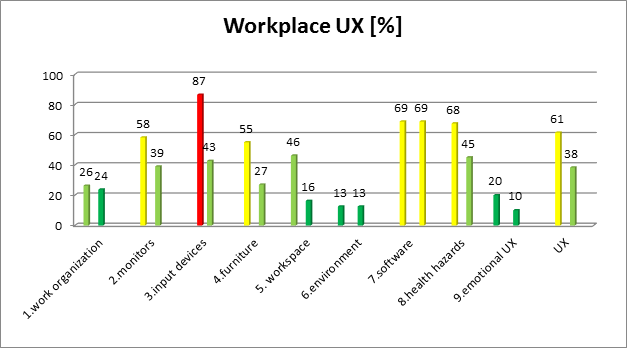
Figure 8. Bar chart summarizing the workplace UX before and after implementation at workplace shown on Fig. 9.
|
Workplace before implementation (left) |
Workplace after implementation (right) |
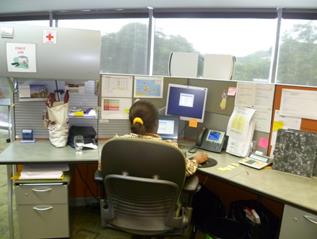
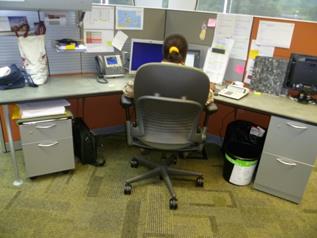
Figure 9. Workplace before and after implementation of corrective low-cost measures. Total UX improvement 38%
Conclusions
A methodology that elaborates the key aspects underlying digital workplaces for user experience design while leveraging ergonomic, affective and personalization dimensions was developed. The results of this study towards UX design of digital workplaces suggest the significance of the research problem as well as the feasibility and potential of the proposed methodology.
Based on the case study of digital workplaces in a big sized company a lot of UX risks and problems for users resulting from badly designed workplaces were allocated. That caused a lot of musculoskeletal disorders, eye discomfort and visual fatigue, stress, etc. Low-cost solutions at 40 workplaces were implemented. It is expected with this implementation to improve the UX by minimum 32%.
For complete optimal solution minimizing UX risk the design of standardized personalizable UX workplaces is proposed. These standardized UX optimized workstations are the best known way to effectively and efficiently perform a job activity with high emotional level. Initial usability study of workplaces in usability lab followed by usability tests in the company is planned. They will be personalizable adapting to specific workplace users. This will be long-term solution independent of job rotations/employee turnover. It is expected UX improvement by more than 60%.
The advantages of methodology proposed are:
(1) significantly reduces the time and errors for UX assessment; (2) applies modern neuro-swarm mathematical model for quantitative UX assessment; (3) reduces the load on the evaluating team when dealing with large companies having numerous departments by screening out departments with bad and moderate UX; (4) supports companies precisely to formulate their strategies for redesign and improvement of their departmental digital workplaces for employees; (5) higher employee satisfaction resulting in increased company profit.
Further research direction for UX design:
1) Digital workplaces with multiple monitors [4], [6], [7].
2) Research applying different metrics for measuring emotional UX at digital workplaces, e.g. multiple physiological measures like EEG, gestural, verbal, or more specialized metrics such as eye-tracking and clickstream data acquired from wearable sensors [1].
References
- 1. Albert A., T. Tullis, Measuring the User Experience: Collecting, Analyzing, and Presenting Usability Metrics, Morgan Kaufman, 2013.
- 2. Ashkanasy N. M., C. E. J. Härtel, W. J. Zerbe (Eds.), Experiencing and Managing Emotions in the Workplace, Emerald Group Publishing, 2012.
- 3. Digital Workplace User Experience. Designing for a flexible workforce, Report of Digital Workplace Forum, http://www.digitalworkplacegroup.com/resources/downloadreports/digitalwo..., 2014.
- 4. Dual monitor ergonomics, http://ehs.iupui.edu/content/doclib/Dual Monitor Ergonomics.pdf, 2014
- 5. Effie L., C. Law, P. van Schaik, Modelling user experience – An agenda for research and practice, Interacting with Computers, 22(5):313322, 2010.
- 6. Ergonomic Guidelines for Dual Monitors, http://www.thezenith.com/employers/services/pi/indsaf/agr/rmb/agricultur..., 2014.
- 7. General guide to use of multiple monitors, http://www.newcastle.edu.au/Resources/Divisions/Services/Human Resource Services/HealthSafety/WorkingSafely/multiplemonitorsguide.pdf
- 8. Kearney D., Ergonomics made easy: A checklist approach, Government Institutes, Rockville, 1998.
- 9. Kennedy J., R.C. Eberhart, Particle swarm optimization, Proc. IEEE International conference on neural networks, Vol.4, 1942–1948, 1995.
- 10. Khan K., A. Nikov, A. Sahai, A fuzzy bat clustering method for ergonomic screening of office workplaces. In: D. Dicheva et al. (Eds.), Software, Services & Semantic Technologies, Advances in Intelligent and Soft Computing, Berlin, Heidelberg: SpringerVerlag, Vol. 101, 59–66, 2011.
- 11. Khan K., A. Nikov, An approach for quick ergonomic risk evaluation of companies with computeraided workplaces, Proc. 5th European Computing Conference ECC '11, Paris, France, , 152157, 2011.
- 12. Kogi K., Lowcost ergonomic solutions in smallscale industries in developing countries, AsianPacific newsletter in occupational health and safety, (4):6870, 1997.
- 13. Nikov A., J. H. Kirchner, D. Elsler, R. Jijanov, A method for screening of enterprises with ergonomic problems illustrated by a case study in Bulgaria, In: A. Seeber (Ed.), Complex work systems, Challenge for analysis and design, Dortmund, GfAPress, 605607, 2000.
- 14. O’Neill M., Adaptable by Design. Shaping the Work Experience, Knoll Inc., http://www.knoll.com/media/239/1002/WP_AdaptablebyDesign.pdf, 2012.
- 15. Rauschenberger M. et al., Measurement of user experience: A Spanish language version of the user experience questionnaire (UEQ), 7th Iberian Conference on Information Systems and Technologies (CISTI), 16, 2012.
- 16. Rosscam E., P. Baichoo, Using ergonomics and ergonomic checkpoints to improve quality of life, African newsletter on occupational health and safety, (7): 3435, 1997.
- 17. Sweany A., Employees are people too: improving webbased user experience in the workplace, http://ausweb.scu.edu.au/aw08/papers/refereed/sweany/paper.html, 2014.
- 18. Vermeeren A. P. O. S., et al., User experience evaluation methods: current state and development needs, NordiCHI '10 Proceedings of the 6th Nordic Conference on HumanComputer Interaction: Extending Boundaries, 521530, 2010.
- 19. Weiß G., Neural networks and evolutionary computation, PartI: Hybrid approaches in artificial intelligence. In: International Conference on Evolutionary Computation, 268–272, 1994.
- 20. Zhou F., Affectivecognitive design of product ecosystems for user experience, Doctoral thesis, Nanyang Technological University, Singapore, 2012.
Papers relacionados