


Workers in the construction industry are exposed to various occupational hazards such as noise, dust, heat, vibrations and others [1]. Machine operators have greater exposure to physical risk factors [2]. Such factors exert influence on human organisms [3], causing changes in hearing thresholds, changes in the circulatory system [4], loss of muscle tone, fatigue [5] and increased irritability [6]. The most commonly used risk assessment methods are analyzing risk factors in isolation, while in the construction industry is common to find presence of more than one risk factor [7]. The combined effects of risk factors on workers' health are still poorly studied. Medical research shows that the human body processes environmental stimuli through the nervous system [8]. This system is also responsible for sending responses for physiological stabilization, also called homeostasis [9]. Some authors have already discussed the possibility of combined effects of environmental stimuli on physiological responses, where their joint actions have the capacity to generate greater impacts on the individual's health [10].
Manninen [11], in his experiment with 11 students in an exhibition chamber, noted that hearing thresholds are affected by whole-body vibrations exposure and thermal stress. The reason given for this phenomenon is that the whole-body vibration exposure causes the resonance of the cranial case intensifying the disturbance of the hearing aid. While thermal stress causes vasodilation of the circulation of hearing aid, so it increases the oxygen supply in the cells and provokes the cellular hyper oxygenation. This potentiates the oxidation of nerve cells in the auditory system.
Seidel [12] observed in 6 people that the influence of occupational vibration on hearing begins to occur after a dose of 0.92m/s2. However, this value may be lower depending on other factors pertinent to the task. In other studies, developed at the time by Dieroff [13] and Erickson, et al. [14], it was realized that instead of a dividing line the combined effects of noise and vibration arise when it is between 1 and 2 m/s2. The range of values cited tends to vary according to the temperature of the place, the physical workload and the psychic physicphysic load of the task.
In a more recent study, Muzammil [15] analyzed the effects of noise and heat on the health of people between 20 and 35 years of age without previous industrial experience. The results of the experiments demonstrated that noise alone does not have a significant influence on the performance at industrial tasks. However, the data collected showed an increase in the heart rate as the energy levels of the experiment increased. This result is in agreement with Sanders & McCormik [16], who argue that noise causes changes in heart rate during the performance of tasks considered to be moderate from the metabolic point of view.
Cognitive effects were also evaluated by other authors. Ljungberg [17], for example, conducted tests in vehicle simulators with 28 students, and he wasn’t able to verify the interference of noise (72 dB (A)) and vibration (0.82 m /s2) on the attention performance of individuals. The author attributed the results to energy levels and the short exposure time15 minutes.
In the field of psychology, attention performance can be assessed through validated tests. The Stroop test is usually chosen for research, mainly due to its availability for mobile application (easy to use in in-field data collection). It evaluates the reaction times of the individual when selecting the name of the color that the participant is visualizing in the screen. The test evaluates both the response rate and the selective response rate. Words indicating colors are sampled and colored differently from textual information. It evaluates the speed of color identification, analysis the identification in the difference between text and color, and the selection of the correct alternative [18].
As explained above, it is possible to verify the existence of studies that considered combined effects of physical risk factors. However, in the literature, no studies of this kind appear to be developed with workers during their actual workdays.
This paper aims to explain the influence of risk factors and their combined effect on workers’ performance, using indicators such as the "Mean Response Time" (MRT) and the "Heart Rate" (HR) during the work of 8 hours.
2.1. Participants (Sample)
Fifteen healthy participants, between 25 and 62 years old, all of them machine operators in the construction industry (elevators, excavators, trucks and tractors) were monitored.
2.2. Structure of Data Collection
At the beginning of the working day the employees were interviewed and introduced to the research objectives. Initial data (weight, age, experience time and physical activity habits) were collected through a specific form. Subsequently, it was explained the necessary equipment for the data collection procedures regarding noise, whole-body vibration, and thermal stress. Then the equipment was installed on the worker and in the workstation. Data regarding mean response time (MRT) and heart rate (HR) were also collected during the beginning of the working day.
The physiological responses were monitored throughout the exposure. That is, during the working day, insertions were made to collect the partial data of MRT and FC. The workday was divided in 5 moments, namely: Start, 1st break, Lunch, Return after lunch, 2nd break and End of the day, characterizing 6 moments of data collection (physiological responses), as shown in figure 1. The interval of time between each moment was approximately 2 hours. This configuration allowed the analysis of the exposure time on the body's responses.
.png)
Fig. 1. Measuring ranges T0 – Tend
2.3. Occupational Noise Evaluation Method
Noise was measured using the methodology proposed by the National Institute for Occupational Safety and Health - NIOSH (1998) [19]. An audiometer was installed in the operator's hearing area, (Model: The Edge5 - Quest / 3M, duly calibrated). The occupational exposure was registered during the minimum period of 6 hours and 30 minutes (75% of the working day), as required by the standard. The equipment was in compliance with all the corresponding international guidelines.
2.4. Whole-Body Vibration Assessment Method
Whole-Body Vibration was measured by using the ISO 2631 [20] recommendations. An accelerometer was installed on the operator’s seat, (Model: HAVpro – Quest/3M, duly calibrated). Data samples were collected in total of 10 minutes throughout the working day. Data was integrated through the software provided by the equipment manufacturer.
2.5. Thermal Stress Assessment Method
Thermal stress was measured using the methodologies described by ISO 7243/1989 [21]. A set of thermometers, (Model: Quest Temp 34, duly calibrated) was used near the work station.
2.6. Attention Performance Test:
For the analysis of the cognitive response time it was used the selective attention test called “Test Stroop”, which relates textual information and colors, as exemplified in figure 6. The test was applied through a mobile application (smartphone). A preliminary test was performed, so that the participants became familiar with the tool, then the tests were performed according to the routine presented in figure 1.
2.7. Heart Rate Measurements:
The heart rate was measured using an oximeter, (Model: CMS50DL - CONTEC). It was installed on the operator's index finger.
2.8. Statistical analysis
The statistical analysis tools of MS EXCEL software were used for data analysis. Multiple linear regressions were computed. The input data (Noise, Whole-Body Vibration and Thermal Stress) were crossed with the output data (Mean Response Time (TMR) and Heart Rate (HR)).
Data were grouped depending on the part of the day in which were collected. The T0 (example), corresponds to the data set from the beginning of the working day (Table 1).
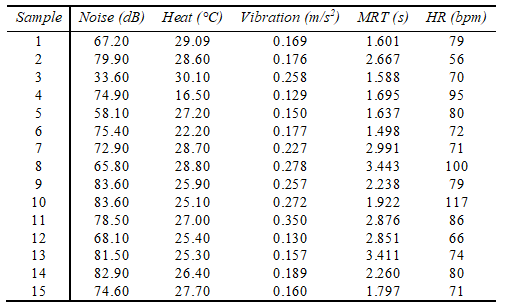
Table 1. Input data for time T0
After organizing the collected data, the statistical computation of multiple linear regression was performed for each data interval (T0, T1, T2, T3, T4 and Tend). The input data (noise, whole body vibration and thermal stress) were crossed with the output data (mean response time - MRT and heart rate - HR) separately.
3.1. Mean Response Time (MRT) Analysis:
Table 2 presents results from the linear regression statistics of the input data with MRT at the beginning of the working day.
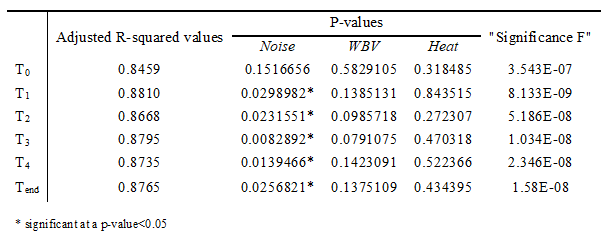
Table 2. Statistical analysis MRT according to each risk factor.
The adjusted R-squared indicates the percentage of the output data (MRT) that can be explained by the multiple linear regression of the input data for the 15 samples. The adjusted R-squared ranged from 0.8459 (T0) to 0.8810 (T2). This means that 84.59% to 88.10% of the collected data can be explained by multiple linear regression, showing that the data have a linear relation superior to 75% during the working day.
Linear regressions have P-values associated with each input data. These values correspond to the level of statistical significance of each input data (Noise, WBV and Heat) on the MRT. Table 7 presents the P-values throughout the working day.
The statistical reference for defining that one variable is significant in relation to another is to be less than 0.05. That is, the input data is significant at the 5% level in relation to the output data. In this context, it is possible to verify that the noise between the T1 and Tend has statistical significance on the TMR, while other data sets did not prove significant.
However, the P values represent only the significance of the input data (isolated) on the regression result. Not being a good parameter for the explanation of the model with a whole.
Therefore, another relevant data of regression is the "Significance F" generated by the ANOVA variability analysis test. This is the standard deviation that measures dispersion around the regression line, also considering a level of 0.05. That is, if F is less than 0.05 the linear relationship is significant at the 5% level. Table 2 presents values of the Significance F throughout the working day.
As the F values were below 0.05, it is possible to state that noise, vibration and heat have a significant multiple linear relationship with the MRT at 5%. It means that the model has reliability greater than 95%.
Therefore, the linear regression for each input variable produces a coefficient. This number corresponds to the degree of influence that the input data has on the MRT. The obtained coefficients were organized in table 3, and their values were correlated with the respective time of the working day.
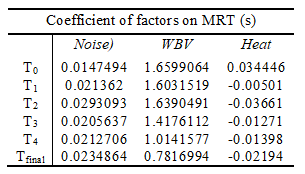
Table 3. Influence of risk factors on MRT during the work day
The data organized in this way allow not only to understand how these variables behave throughout the day, but also to verify their degree of influence on the cognitive deficit (MRT). Figure 2 shows the graph generated from the tabulated data and illustrates the behavior of the input data over the MRT.
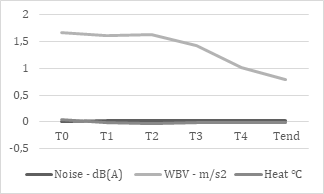
Fig. 2. Influence of risk factors on MRT during the working day.
The influence of full body vibration reduces as the working day progresses. In the first stage of the working day (T0 - T2) the influence of vibration is visually constant. While in the second stage (T3 - Tend) the coefficient is noticeably decreasing. This is associated with worker's adaptation. That is, the vibration is assimilated by the body reducing its degree of influence on cognitive performance.
As the numerical difference between the coefficient of the WBV and the other variables is high, the same was excluded from the graph. The graph of figure 3 containing the coefficients of noise and thermal stress is generated.
.png)
Fig. 3. Influence of noise and thermal stress on MRT during the working day.
The influence of noise presents a slight trend of growth throughout the day. This demonstrates that the cognitive performance of a task is increasingly influenced by noise as the workday progresses. This phenomenon occurs because the noise has a close connection to the central nervous system, affecting concentration and increasing irritability.
Figure 3 also shows the importance of the pause (T2 - T3) to reduce the effects of noise on MRT. This is evident from the decrease in the growth tendency of the coefficient in this interval.
Thermal stress showed to be more influential at the beginning of the journey, losing this capacity even in the first stage of work (T0 - T2). It presented negative coefficient values until the end of the working day. This phenomenon leads to the interpretation that for the 15 samples, thermal stress helped the workers' cognitive performance. However, to be conclusive, more samples will be needed.
3.2. Heart Rate Analysis (HR):
Table 4 shows results of linear regression statistic of the input data with the HR at the beginning of the working day.
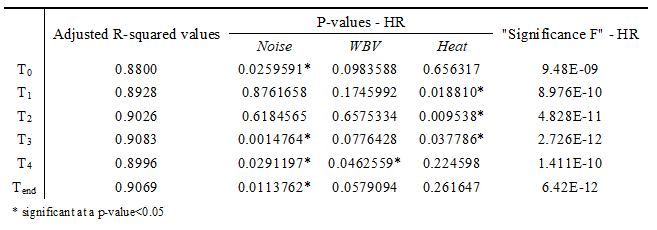
Table 4. Statistical analysis of the HR for each risk factor
The adjusted R-squared indicates the percentage of output data (HR) that can be explained by the multiple linear regression of the input data for the 15 samples. The adjusted R-squared ranged from 0.8800 (T0) to 0.9083 (T3). This means that 88.00% to 90.83% of the data collected can be explained by multiple linear regression, showing that the data have a linear relation superior to 75% during the working day.
Linear regressions have P values associated with each input data. These values correspond to the level of statistical significance of each input data (Noise, WBV and Heat) on the HR. Table 4 presents the P-values throughout the working day.
The statistical reference for defining that one variable is significant in relation with another is to be less than 0.05. That is, the input data is significant at the 5% level in relation to the output data. In this context, it is possible to verify that the noise in T1, T3, T4 and Tend, the heat between T1 and T3 and the WBV in T4 have statistical significance on HR, while other intervals were not significant.
However, the P values represent only the significance of the input data (isolated) on the regression result. Not being a good parameter for the explanation of the model with a whole.
Therefore, another relevant data of regression is the "Significance F" generated by the ANOVA variability analysis test. This is the standard deviation that measures dispersion around the regression line, also considering a level of 0.05. That is, if F is less than 0.05 the linear relationship is significant at the 5% level. Table 14 shows values of Significance F throughout the working day.
As the values of F were below 0.05, it can be stated that noise, vibration and heat have a significant multiple linear relationship with HR at 5%. That is, the model has reliability greater than 95%.
Therefore, the linear regression for each input variable produces a coefficient. This number corresponds to the degree of influence that the input data exerts on the HR. The obtained coefficients were organized in table 5, and their values were correlated with the respective time of the working day.
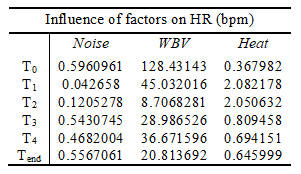
Table 5. Influence of risk factors on HR during the work day.
The data organized in this way allow not only to understand how these variables behave throughout the day, but also to verify their degree of influence on the heart rate of the operators. Figure 4 shows the graph generated from the tabulated data and illustrates the behavior of the input data over HR.
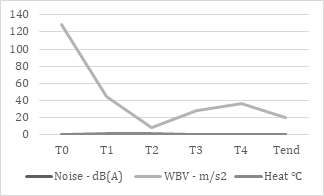
Fig. 4. Influence of risk factors on HR during the working day
The influence of full body vibration reduces as the workday progresses. In the first phase of the workday (T0 - T2) the influence of the vibration is decreasing. While in the second phase (T3 - Tend) the coefficient increased and stabilized until the end of the working day. This is associated with worker's adaptation. That is, the vibration is assimilated by the body reducing its degree of influence on the heart rate.
As the numerical difference between the coefficient of the WBV and other variables is high, the same was excluded from the graph. Figure 5 shows the graph containing coefficients of noise and thermal stress.
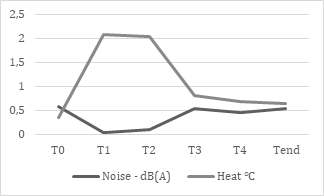
Fig. 5. Influence of noise and thermal stress on HR during the working day
The influence of noise presents a slight downward trend at the beginning of the journey, between T0 and T2, while increasing and being stable in the second part of the day, between T3 and Tfinal. Thermal stress was shown to be more influential 2 hours after the start of the working day. This variation may be associated with a change in temperature during the day. However, in the second part of the day (T3 - Tend) this influence falls to the initial levels of the working day. Figure 5 shows the graph revealing the importance of the rest periods (T2 - T3), in order to reduce the effects of thermal stress on the HR. This is evident in the decrease of the coefficient growth trend in this interval. The coefficients show that heat, vibration and noise have a direct influence on heart rate for the evaluated 15 samples. However, to be conclusive, more samples will be needed.
The analyzed physical risk factors (noise, whole-body vibration, and thermal stress) seems to influence cognitive performance (MRT) and heart rate. However, each physical risk factor has a different degree of influence for each analyzed physiological variable.
Throughout the working day, the degrees of influence of physical risk factors are also variable, increasing or decreasing their influence on MRT and HR depending on the specific period of the working day.
Exposure to whole-body vibration, in relation to cognitive performance, exerts influence at the beginning of the working day, but loses its effect throughout the day. This behavior may be associated with the physiological assimilation (adaptation) of the energy. The organisms through the mechanism of homeostasis (changes in hemodynamics and muscle tonus) adapt to vibration stimuli, promoting greater cellular oxygenation (including the central nervous system), causing their influence on MRT to decrease throughout the working day.
Exposure to whole-body vibration in relation to HR also showed a higher degree of influence at the beginning of the working day, losing this effect during the working day. This phenomenon can be explained with the physiological assimilation (adaptation) to the condition. Similar to what happens in sports practice. At the beginning of the workout the heart rate increases to supply the cellular demands generated by the activities. Afterward stabilizes within a certain range corresponding to the equilibrium condition. In this context, the influence of the WBV on HR is greater at the beginning of the day due to the muscular movement caused by it. Nevertheless, it reduces its influence if the organism stabilize in the circulatory point of view.
Noise influences both cognitive performance and HR. For the two physiological variables, it was shown to be stable throughout the working day with a slight upward trend over the MRT.
The thermal stress in relation to cognitive performance exerts influence at the beginning of the working day. However, after 2 hours it inverses its effect in the beginning of the working day and remains stable until the end of the day.
Thermal stress in relation to HR increases its influence as the working day advances. Lower coefficient was present in the T0 and high coefficients between T1 and T2 returning to decrease in T3.
The resting period (T2 - T3) promotes the physiological recovery of the individual, affecting the growing tendency of the influence of noise on cognitive performance and reducing this degree of influence.
The resting period (T2-T3) also influence the temperature and heart rate, promoting the reduction of this degree of influence after the interval.
The data statistical treatment presented adjusted R-squared values above 75% demonstrating that the combined effects of physical risk factors on MRT and HR can be explained through multiple linear models.
Most of input data were with P-values outside the 0.05 significance range. However, the values of significance F for analyzed regressions were within the 5% significance range, i.e., the data had a linear relationship with significance above 95%.
Thus, the research shows evidence that physical risk factors, when analyzed separately, do not have significant influence on the physiological responses of MRT and HR, but when analyzed in combination their impact seems to be significant.
This preliminary research shows the need to further study the synergistic effects of the simultaneous exposure to multiple physical risk factors on workers' health and performance.
[1] Barkokébas, B. J., Lordsllem Junior, A. C., & Vasconcelos, B. (2009). Sistema de Gestão em Segurança e Saúde do Trabalho. Recife-PE: EDUPE.
[2] Cruz, F. M., Lago, E. G., & Barkokébas Jr, B. (2013). Evaluation of Noise Generated by Propagation Equipment Beat Stakes Construction Sites. Em P. M. Arezes, J. S. Baptista, M. P. Barroso, P. Carneiro, P. Cordeiro, N. Costa, . . . G. Perestrelo, Occupational Safety and Hygiene. Guimarães-Portugal: CRC Press.
[3] Evgen’Ev, M. B., Garbuz, D. G., & Zatsepina, O. G. (2014). Heat shock proteins and whole body adaptation to extreme environments. Moscow: Springer Netherlands.
[4] Manninen, O. (1984). Hearing threshold and heart rate in men after repeated exposure to dynamic muscle work, sinusoidal vs stochastic whole body vibration and stable broadband noise. Int Arch Occup Environ Health, pp. 19-32.
[5] Li, Z., Zhang, M., Chen, G., Luo, S., Liu, F., & Li, J. (2012). Wavelet analysis of lumbar muscle oxygenation signals during whole-body vibration: Implications for the development of localized muscle fatigue. European Journal of Applied Physiology, pp. 3109-3117.
[6] Ljungberg , J., Neely, G., & Lundstrom, R. (2004). Cognitive performance and subjective experience during combined exposures to whole-body vibration and noise. Int Arch Occup Environ Health , pp. 217–221 .
[7] Van Der Molen, H. F., De Vries, S., Jill Stocks, S., Warning, J., & Frings-Dresen, M. (2016). Incidence rates of occupational diseases in the Dutch construction sector, 2010-2014. Occupational and Environmental Medicine, pp. 350-352.
[8] Celani, A., & Vergassola, M. (2012). Nonlinearity, fluctuations, and response in sensory systems. Physical Review Letters.
[9] Schulkin, J. (2015). Allostasis, homeostasis, and the costs of physiological adaptation. Washington, DC: Cambridge University Press.
[18] Kaas, J. H. (2010). Evolution of nervous systems. Nashville: Elsevier Inc.
[11] Manninen, O. (1983a). Simultaneous Effects of Sinusoidal Whole Body Vibration and Broadband Noise on TT 5 2's and R-Wave Amplitudes in Men at Two Different Dry Bulb Temperatures. Int Arch Occup Environ Health, pp. 289-297.
[12] Seidel, H., Harazin, B., Pavlas, K., Sroka, C., Richter, J., Bliithner, R., . . . Rothe, R. (1988). Isolated and combined effects of prolonged exposures to noise and whole-body vibration on hearing, vision and strain. Int Arch Occup Environ Health , pp. 95-106.
[13] Dieroff, H. D. (1982). Behavior of high-frequency hearing in noise. Audiology, pp. 83-92 .
[14] Erickson, D. A., Fausti , S. A., Frey , R. H., & Rappaport , B. Z. (1980). Effects of steady-state noise upon human hearing sensitivity from 8000 to 20000 Hz . Am Ind Hyg Assoc J, pp. 427-432 .
[15] Muzammil, M., Ali Khan, A., & Hasan, F. (2007). Effect of noise, heat stress and exposure duration on operators in a die casting operation. Occupational Ergonomics, pp. 233-245.
[16] Sanders, M. S., & McCormik, E. J. (1992). Human Factors in Engineering and Design. McGraw Hill International Editions, pp. 551-588.
[17] Ljungberg, J. (2007). Cognitive degradation after exposure to combined noise and whole-body vibration in a simulated vehicle ride . Int. J. Vehicle Noise and Vibration, pp. 130-142.
[18] Ergen, M., Saban, S., Kirmizi-Alsan, E., Uslu,, A., Keskin-Ergen, Y., & Demiralp, T. (01 de December de 2014). Time-frequency analysis of the event-related potentials associated with the Stroop test. International Journal of Psychophysiology, pp. 463-472.
[19] National Institute for Occupational Safety and Health. (1998). Occupational Noise Exposure - Criteria for a Recommended Standard. Cincinnati: NIOSH.
[20] International Organization for Standardization. (1997). ISO 2631-1 - Mechanical Vibration and Shock - Evaluation of Human Exposure to Whole Body Vibration - Part 1: General Requirements. Switzerland: ISO.
[21] International Organization for Standardization. (1989). Hot environments - Estimation of the heat stress on working man, based on the WBGT-index (wet bulb globe temperature). Switzerland: ISO.
Papers relacionados