


It is common for machine operators in the construction industry exposing to noise and whole-body vibration (WBV) simultaneously during the exercise of their activities. There are several references that show their effects on the worker's health when they are studied separately. However, the combined analysis of multiple risk factors is still little explored. Therefore, the search for an understanding of the possible effects on workers' health during exposures to multiple risk factors simultaneously can bring new understandings regarding the impacts on the performance of tasks and the possible manifestation of occupational diseases.
When exposed to a risk factor, the worker's body tends to manifest physiological responses to reestablish its internal balance. Such a theory is evidenced by Li et al. [1] which demonstrated the oxygenation deficiency of lumbar muscle tissue during exposure to whole body vibrations, with energy levels like those found in construction machines. Low oxygenation is one of the indicators of energy exhaustion and muscle fatigue. While for noise exposure, according to Donáth [2], despite its direct impact on the hearing system, its greatest impact occurs in the central nervous system, considering that encodings of sound information require energy expenditure related to brain activities.
In the construction industry it is common for machine operators to simultaneously expose themselves to these two physical risk factors. Gholami et al. [3] in their studies evidence the mental fatigue that results from the noise of the work environment. According to these authors, exposure to noise influences cognitive performance, in aspects such as attention, memory and concentration. This influence was also studied by Shih et al. [4] which demonstrated the existence of a relationship between the frequency and amplitude of the sound wave and the performance of mental tasks. His experiments showed that sounds with verbal information hamper the exercise of attention and concentration.
Because of the direct link between the central nervous system and muscle fibers, muscles receive constant feedback from nerve cells. According to Solberg [5], the nervous system when overloaded by stimuli can cause micro electric discharges on the muscle fiber, causing an increase of its contraction. For Noda [6], such an effect may cause an excessive consumption of energy due to excessive contractions, contributing to the accentuation of the muscular wear and consequent predisposition of the fiber to the premature fatigue, collaborating with muscular exhaustion and increased stress.
Regarding the whole-body vibration, for Cardinale & Bosco [7] the frequency, amplitude and magnitude are mechanical variables that determine the intensity of the vibration. Each part of the human body has its own frequency, called the resonance frequency. As an example of these frequencies (with approximate values), Komi [8] cites the eyes with 20 Hz, the head with 18 Hz, the internal organs with 8 Hz and the muscles with 715 Hz. When the frequency of vibration coincides with the natural frequency of the system it can cause a resonance in the human body subjecting it to dangerous oscillations that can cause damages [9].
According to Willems [10], muscle tissue can change its overall functional capacity in responses to different stimuli. Thus, the human body responds to vibrations in a complex way because it imposes the increase of the muscular power as a function of the intensity of the acceleration. Thus, Tankisheva et al. [11] demonstrated that the mechanical action of the vibration triggers an effect of changing the length of the tendons (musculotendinous). These disturbances are perceived by sensory receptors that modulate muscular rigidity through a reflexive muscular activity, trying to cushion the vibratory waves.
According to Cakar et al. [12], when the musculature is exposed to vibrations, three motor effects are generated. The first is "sustained contraction" in which the exposed muscle actively contracts as a result of the stimulation of muscle spindles. The second is excitability / irritability, that is, the nervous system reduces the sending of information to contraction, considering that the muscular set is already on strong stimulus. And the third is the reduction of the myotatic reflex of the musculature. In this context, Bongiovanni et al. [13] explain that vibration primarily affects the individual's ability to generate and maintain muscle activity, ie, vibration above the limits of motor ability leads to a loss of muscle strength.
In addition to the musculature aspects, the vibrations also have effects on the vascular system. According to Kerschan-Schindl et al. [14], the accelerations applied in adult individuals in the standing position cause changes in the color of the skin, being more visible in the feet and calf. Other effects caused by vibrations are increased blood flow in the lower limbs and significant reduction of peripheral vascular resistance in such limbs. Inducing the enlargement of the small vessels of the peripheral circulation.
Zhang et al. [15] doing research with adults, detected an increase in blood flow in the tibial musculature after exposure. According to Sackner et al. [16], in research with adult men, observed that they presented tolerance to vibrations during 45 minutes followed by an acceleration of 2.2 m / s^2. After 45 minutes, Mester et al. [17] explain that the shear stress of the blood vessels is ruptured, causing vasodilation and increased blood flow in the muscle fibers.
Lohman et al. [18] further explains that mechanical vibrations have effects on endothelial cells, with endothelial stress leading to increased production of nitric oxide, which has muscle relaxant function. Such a condition may lead to reduced muscle tone during exposure.
In view of the above, it is possible to verify that muscular effects, changes in the circulatory system, effects on the central nervous system occur at the same time during the exercise of the work for the construction machinery operators. As the systems mentioned are intrinsically linked, it is not possible to dissociate the influence of one over the other. In this context, the search for methodologies that investigate risk factors in a combined way is necessary to construct new understandings about occupational exposure.
In recent studies, Arezes et al. [19] analyzed the interaction between noise, whole body vibration and thermal stress in construction machine operators, identified that physical risk factors appear to influence cognitive performance (MRT). However, each physical risk factor has different degrees of influence throughout the working day, increasing or decreasing its influence on MRT during the work day.
In another study Cruz et. al. [20] also identified that the physical risk factors generated by operations using construction machines have different degrees of influence on blood oxygenation (SpO2). And that each factor has a different weight in the SpO2 level of the operator, and that influence varies during each period of the work day.
The aim of the current article was to develop a numerical model capable of explaining the relationship between simultaneous exposure to noise and WBVs from construction machine operations.
2.1. Participants
Forty-nine healthy participants, between 25 and 62 years old, all of them machine operators in the construction industry (elevators, excavators, trucks and tractors) were monitored.
2.2. Structure of Data Collection
At the beginning of the working day the employees were interviewed and introduced to the research objectives. Initial data (weight, age, experience time and physical activity habits) were collected through a specific form. Subsequently, it was explained the necessary equipment for the data collection procedures regarding noise, WBV, and thermal stress. Then the equipment was installed on the worker and in the workstation. Data regarding mean response time (MRT) were also collected during the beginning of the working day.
The cognitive performance was monitored throughout the exposure. That is, during the working day, insertions were made to collect the partial data of MRT. The workday was divided in 5 moments, namely: Start, 1st break, Lunch, Return after lunch, 2nd break and End of the day, characterizing 6 moments of data collection (physiological responses), as shown in figure 1. The interval of time between each moment was approximately 2 hours. This configuration allowed the analysis of the exposure time on the body's responses.
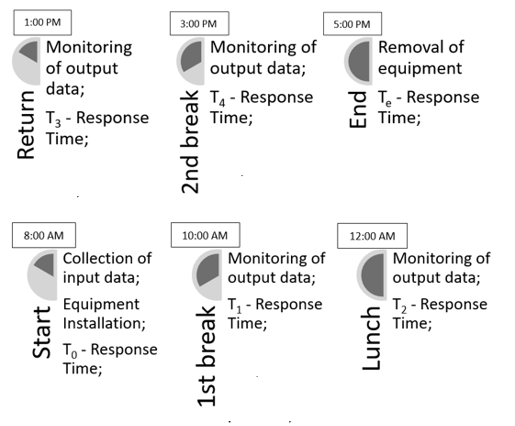
Fig. 1. Measuring Periods
2.3. Occupational Noise Evaluation Method
Noise was measured using the methodology proposed by the National Institute for Occupational Safety and Health - NIOSH (1998) [19]. A noise dosimeter was installed close to the operator's ear (Model: The Edge5 - Quest / 3M, duly calibrated). The occupational exposure was registered during the minimum period of 6 hours and 30 minutes (75% of the working day), as required by the standard. The equipment followed all the corresponding international guidelines.
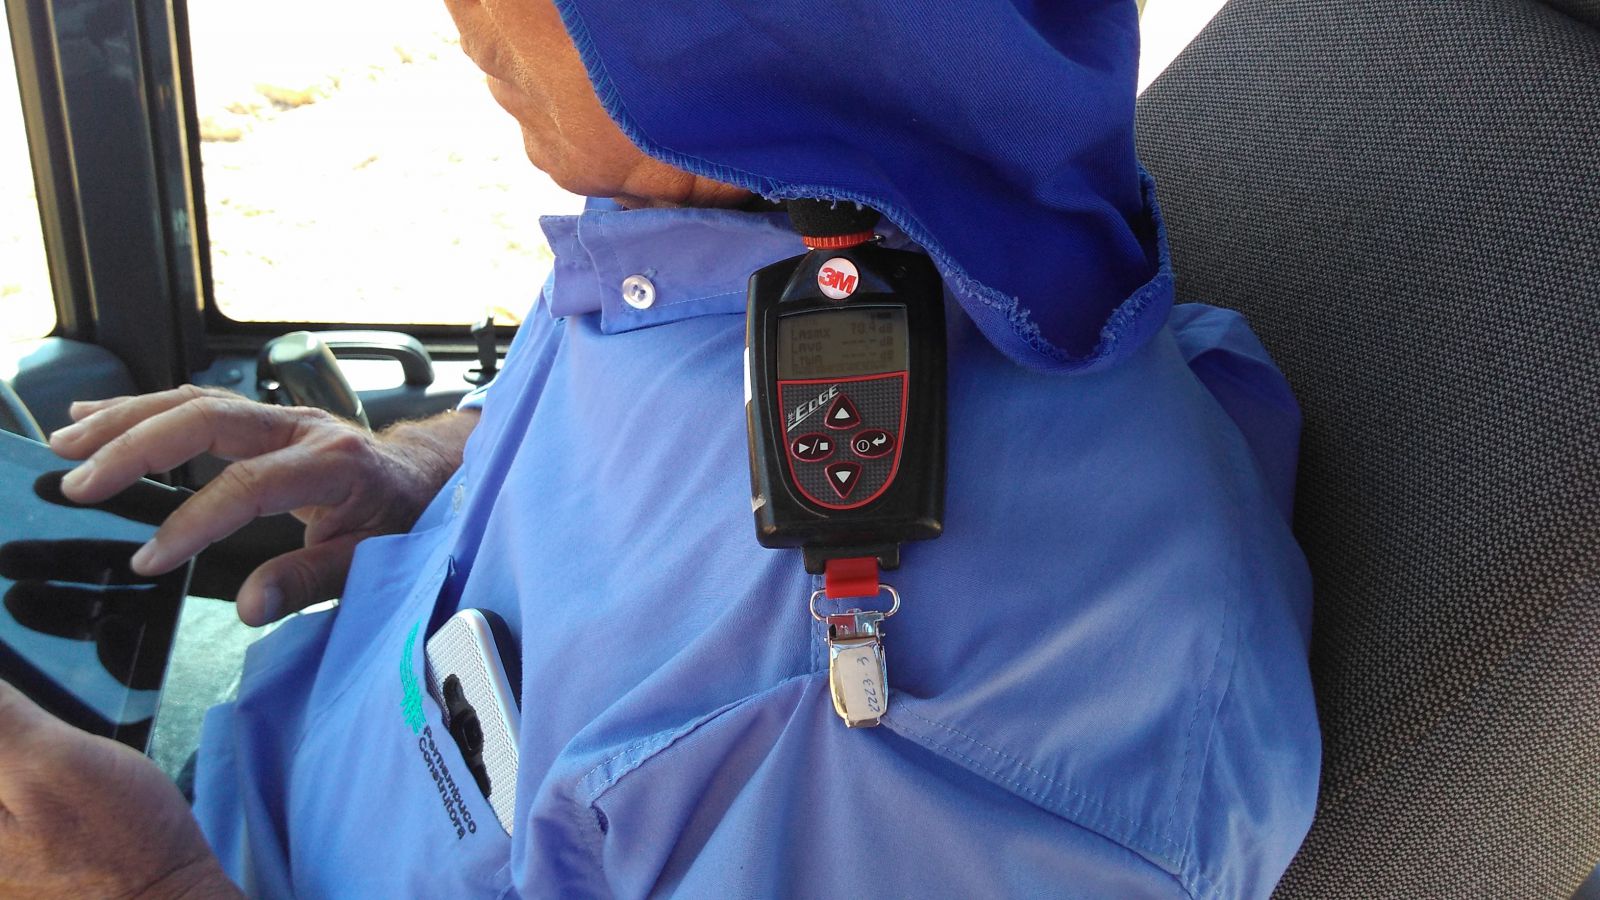
Fig. 2. Noise dosimeter
2.4. WBV Assessment Method
WBV was measured by using the ISO 2631 [20] recommendations. An accelerometer was installed on the operator’s seat, (Model: HAVpro – Quest/3M, duly calibrated). Data samples were collected in total of 10 minutes throughout the working day. Data was integrated through the software provided by the equipment manufacturer.

Fig. 3. Accelerometer installed in the machine seat.
2.5. Attention Performance Test:
For the analysis of the cognitive response time it was used the selective attention test called “Test Stroop”, which relates textual information and colors, as exemplified in figure 6. The test was applied through a mobile application (smartphone). A preliminary test was performed, so that the participants became familiar with the tool, then the tests were performed according to the routine presented in figure 1.

Fig. 4. Mobile application interface used for the Stroop test.
The data were grouped in a structured way in a table, permitting the application of statistical tools to analyze them. Table 1 shows the data obtained during the experiment.
Table 1. Data recorded - Physical risk factors and mean response time (MRT).
.png)
After the organization of the collected data, the statistical calculation of the statistical correlation between the noise and the body vibration data with the cognitive performance of the mean response time (MRT) was performed. Data from each risk factor were initially tested separately. The data were then combined using the standard multiplied liner regression calculation. A numerical model capable of explaining the relationship between the physical risk factors and the mean response time (MRT) was obtained.
3.1. Correlation analysis between physical risk factors exposure and MRT:
In statistics, the relationship between two variables is called correlation. The importance of such determination occurs because, when proven its existence is possible to estimate one variable from the other. However, when correlation does not exist it is necessary to use other methods to analyze the data. Initially, we attempted to verify if there was any relationship between the data collected. For this, the noise dispersion (Lavg) and whole body vibration (Aeq) data were plotted separately for the MRT data. The analysis of the dispersion graph allowed us to interpret the correlations of the physical risk factors with the dependent variables, based on the approximation of the points. When points tend to align, this suggests that there is a strong correlation between variables. When dispersed, there is a weak correlation between the variables. In view of the above, it is possible to observe in Figure 5 the scatter diagrams of the data of the risk factors in relation to the MRT.
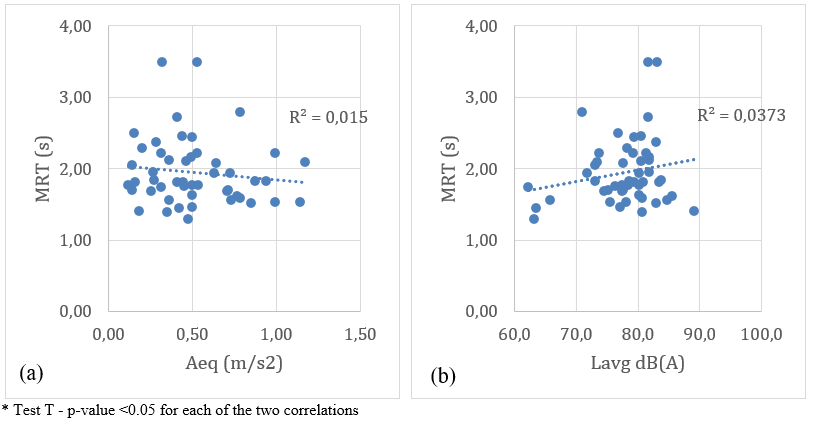
Fig. 5. Correlation between data of physical risk factors and MRT. (a) Aeq vs. MRT; (b) Lavg vs. MRT.
According to figure 5a, it is possible to verify that the Aeq values have a weak correlation with the MRT. This is because the dots are not grouped in the shape of a line in such a way as to characterize a strong correlation. And the value of R2 shows that only 1.5% of the vibration data can explain MRT values. The same occurs in Figure 5b, where the Lavg values also do not group in line and the value of R2 shows that only 3.7% of the Lavg data can explain the MRT data, in this way there is a weak correlation of the noise with the MRT.
In this context, when the values of the risk factors are compared separately with the workers' TMR, it can be observed that for both cases there is a weak correlation between the risk factor data and the MRT data. Therefore, the values of the risk factors separately cannot explain the MRT values.
This happens because there was no statistical correlation between the variables or the same low level, another method was applied, which instead of evaluating the values of the risk factors separately, combined to show that the physical risk factors can only explain the MRT when analyzed in combination. For this reason, the multiple linear regression models - MRL of the basic type were applied to the data collected from the 49 construction machine operators.
3.2. Multiple Linear Regressions (MLR) Analysis:
The analysis through MLR assumes that in certain cases a given variable may be related to two or more variables. Thus, MLR is the one that best suits the analysis of dependent variables with multiple independent variables. This condition resembles the occupational exposures of machine operators in construction, which are exposed to noise and whole-body vibrations (independent variables) and manifest responses (dependent variables) that for the case under study is MRT. Considering that such responses reflect the simultaneous exposure to the physical risk factors.
Thus, the purpose of MLR is to establish the equation that expresses the Mean Time of Response - MRT as a function of the noise and vibration factors of the whole body. As shown, it is not possible to explain in isolation the influence of noise and whole-body vibration on the performance of the mean response time - TMR. However, when analyzed in a combined way, through MLR, noise and whole-body vibration have significant multiple linear relationship with the TMR at the 5% level, as expressed by the F value of signification in table 2. That is, the model has more than 95% reliability.
Table 2. Statistical analysis MRT according to each risk factor.

The adjusted R-squared indicates the percentage of the output data (MRT) that can be explained by the multiple linear regression of the input data for the 49 samples. The adjusted R - squared was 0.92, meaning that 92% of the MRT data can be explained by the equation presented in table 2.
Linear regressions have P-values associated with each input data. These values correspond to the level of statistical significance of each input data (Noise and WBV) on the MRT. Table 2 presents the P-values. The statistical reference for defining that one variable is significant in relation to another is to be less than 0.05. That is, the input data is significant at the 5% level in relation to the output data. In this context, it is possible to verify that the noise has statistical significance on the MRT, while the WBV data sets did not prove significant.
However, the P values represent only the significance of the input data (isolated) on the regression result. Not being a good parameter for the explanation of the model with a whole. Therefore, another relevant data of regression is the "Significance F" generated by the ANOVA variability analysis test. This is the standard deviation that measures dispersion around the regression line, also considering a level of 0.05. That is, if F is less than 0.05 the linear relationship is significant at the 5% level. Table 2 presents values of the Significance F. As the F values were below 0.05, it is possible to state that noise and vibration have a significant multiple linear relationship with the MRT at 5%. It means that the model has reliability greater than 95%.
Statistical analyzes have shown that MRT seems to be better explained when data from physical risk factors are combined in multiple linear regression (MLR) models. By analyzing the correlation between the data of the physical and MRT risk factors, it can be observed that the separate noise data have a weak statistical correlation with the MRT data of the construction equipment operators. That is, when the noise level data separately cannot relate to the MRT values of the operators.
Similarly, separate WBV also have poor statistical correlation with the average response time of operators. Thus, the data of the physical risk factors (noise and WBV) when analyzed separately are not able to explain the average response time data of the construction machine operators.
However, the applied multiple linear regression (MLR) shows that the exposure to the physical risk factors can explain 92% of the MRT data of the construction machine operators. That is, MRT observation should consider physical risk factors in a combined manner, since when separately the risk factors do not correlate with the MRT.
The study of occupational exposure patterns through multiple linear regressions (or other statistical tools that aid in the interpretation of these patterns) seems to be the next challenge to be overcome. In future work, the identification of patterns and prediction of consequences through predictive models should be explored, in particular models related to occupational accidents occurrence, workers’ behavior, among others.
[1] Li, Z., Zhang, M., Chen, G., Luo, S., Liu, F., & Li, J. (2012). Wavelet analysis of lumbar muscle oxygenation signals during whole-body vibration: Implications for the development of localized muscle fatigue. European Journal of Applied Phys iology , 112(8), 3109–3117.
[2] Donáth, T. (2006). Effects of environmental noises and sounds on the quality of life controlled by the central nervous system. Orvosi Hetilap , 147(16), 737–739.
[3] Gholami, T., Veyseh, P. P., Aliabadi, M., & Farhadian, M. (2014). Study of noise pollution and its effects on subjective fatigue of staff in the governmental banks of Hamadan city. Iran Occupational Health, 11(5), 65–73.
[4] Shih, Y. N., Huang, R. H., & Chiang, H. Y. (2012). Background music: Effects on attention performance. Work, 42(4), 573–578.
[5] Solberg, G. (2008). Postural disorders & musculoskeletal dysfunction. Netanya: Elsevier Ltd.
[6] Noda, M. (2011). Mechanosensing biology. Tokyo: Springer Japan.
[7] Cardinale, M., & Bosco, C. (2003). The use of vibration as an exercise intervention. Exercise and Sport Sciences Reviews, 31(1), 3–7.
[8] Komi, P. V. (2007). Força e potência no esporte. São Paulo: Artmed.
[9] Silva, H. R., Couto, B. P., & Szmuchrowski, L. A. (2008). Effects of mechanical vibration applied in the opposite direction of muscle shortening on maximal isometric strength. Journal of Strength and Conditioning Research, 22(4), 1031–1036.
[10] Willems, M. (2013). Skeletal muscle: Physiology, classification and disease. United Kingdom: Nova Science Publishers, Inc.
[11] Tankisheva, E., Jonkers, I., Boonen, S., Delecluse, C., Harry van Lenthe, G., Druyts, H. L., Verschueren, S. M. P. (2013). Transmission of whole-body vibration and its effect on muscle activation. Journal of Strength and Conditioning Research, 27(9), 2533–2541.
[12] Cakar, H. I., Cidem, M., Sebik, O., Yilmaz, G., Karamehmetoglu, S. S., Kara, S., … Türker, K. S. (2015). Whole-body vibration-induced muscular reflex: Is it a stretch-induced reflex? Journal of Physical Therapy Science, 27(7), 2279–2284.
[13] Bongiovanni, L. G., Hagbarth, K. E., & Stjernberg, L. (1990). Prolonged muscle vibration reducing motor output in maximal voluntary contractions in man. The Journal of Physiology, 423(1), 15–26.
[14] Kerschan-Schindl, K., Grampp, S., Henk, C., Resch, H., Preisinger, E., Fialka-Moser, V., & Imhof, H. (2001). Whole-body vibration exercise leads to alterations in muscle blood volume. Clinical Physiology, 21(3), 377–382.
[15] Zhang, Q., Ericson, K., & Styf, J. (2003). Blood flow in the tibialis anterior muscle by photoplethysmography during foot-transmitted vibration. E u r o p e a n J o u r n al of A p plie d Physiology, 90(5–6), 464–469.
[16] Sackner, M. A., Gummels, E., & Adams, J. A. (2005). Nitric oxide is released into circulation with whole-body, periodic acceleration. Chest, 127(1), 30–39.
[17] Mester, J., Kleinöder, H., & Yue, Z. (2006). Vibration training: Benefits and risks. Journal of Biomechanics, 39(6), 1056–1065.
[18] Lohman, E. B., Petrofsky, J. S., Maloney-Hinds, C., Betts-Schwab, H., & Thorpe, D. (2007). The effect of whole-body vibration on lower extremity skin blood flow in normal subjects. Medical Science Monitor, 13(2), 71–76.
[19] Arezes, P., Cruz, F. M., Barkokébas, B. Jr. (2017). Combined Effects of Exposure to Physical Risk Factors: Impact on Cognitive and Physiological Performance of Construction Workers. Proceedings from: ORP Journal 17th International Conference on Occupational Risk Prevetion. Buenos Aires, AR.
[20] Cruz, F. M., Arezes, P., Barkokébas, B. Jr., Martins, E. B. (2018). Combined effects of exposure to physical risk factors: Impact on blood oxygen saturation (SpO2) in construction workers. In Occupational Safety and Hygiene VI 2018 (pp. 279–283). London, UK: CRC Press.