


Melo, Rui B.
Ergonomics Department/Technical University of Lisbon/ Estrada da Costa/1495-668 Cruz Quebrada/Portugal e- mail: rmelo@fmh.utl.ptPhone: +351- 214 149 128Rôla, SusanaErgonomics Department/Technical University of Lisbon/ Estrada da Costa/1495- 668 Cruz Quebrada/Portugale- mail: susana.rola@gmail.com Phone: +351- 214 149 118Miguel, A. SérgioHuman Engineering Group /Production & Systems Department/ University of Minho/Campus de Azurém/4800-058 Guimarães/Portugale- mail: asmiguel@dps.uminho.ptPhone: +351- 253 510 369Simões, AnabelaErgonomics Department/Technical University of Lisbon/ Estrada da Costa/1495- 668 Cruz Quebrada / Portugale- mail: asimoes@fmh.utl.ptPhone : +351- 214 149 118
ABSTRACT
The main goals of this study were to evaluate whole- body vibration exposure of bus drivers operating in an urban environment and to find the prevalence of self reported health problems among them.
ISO 2631- 1 guidelines were fo llowed when measuring, evaluating and assessing whole- body vibration exposures. Additionally, the effectiveness of vibration attenuation of bus seats was investigat ed. A questionnaire was applied to assess drivers’ health problems.
The vertical axis was do minant for the drivers’ exposure. The obtained mean seat transmissibility factor included values greater than one, demonstrating some ineffectiveness of the seat suspension systems.
Low back pain was the most referred symptom.
Keywords
Whole- body vibration, occupational exposure, bus, drivers.
INTRODUCTION
The vibration environment is a common man- made artificial surrounding with which most humans have to deal. However, professionals such as occupational drivers do it on a daily basis.
It seems that humans have a limited tolerance to cope with whole - body vibration (WBV). Two update reviews of epidemiologic studies provided evidence of a positive relationship between low back pain and WBV exposure [2,7]. In fact, Bovenzi and Zadini [3] concluded that bus driv ing is associated with an increased risk for low back troubles, possibly due to both WBV exposure and prolonged sitting in a constrained posture. Lifting, carrying, and psychosocial issues are commonly added to the causal factors of low back problems [7, 8,11]. Some European countries (Belgium, France, Germany and The Netherlands) consider, under certain circumstances, back disorders occurring in workers exposed to WBV as an occupational disease [1].
A number of factors can affect the level of WBV experienced by a vehicle operator, when driving over a given surface, at a given speed. These include the presence of suspended axle(s), suspended cab, and the type/complexity of seat suspension. However, basic properties such as vehicle mass, wheelbase, tyre size, tyre stiffness and inflation pressure can also play contributory roles [4,9,12].
T he Physical Agents (Vibration) Directive [5] establishes two reference daily exposure values: an action value of 0.5 m s- 2 (EAV) and a limit value of 1.15 m s-2 (ELV), both standardized for a reference period of 8 hours . The adoption of this Directive by the European Union countries will limit WBV daily exposure levels of vehicle operators, thereby potentially imposing changes to bus design at a time when the transportationindustry is under severe economic pressure due to petrol prices.
The objective of this work was to undertake a pilot research study to quantify WBV emission levels found in a range of different buses, operating in an urban environment, comprising different ground surfaces. On the other hand, it was also our intention to determine the prevalence of health complaints among this group of drivers.
MATERIALS & METHODS
Participants
A group of 66 male drivers participated in this study. They were randomly selected from those scheduled to the itineraries being evaluated. Table 1 presents their characteristics.
Table 1 – Drivers data.
Statistics Age (years)
Weight (kg)
Height (cm)
Driving experience (years)
Mean 38.1 80.7 172 10.2
S.D. 10.5 12.0 0.1 8.7
Minimum 23 58 155 0.5
Maximum 63 115 192 28
Buses
Our sample included fifty six vehicles, covering nine different models from four major manufacturers (MAN, Volvo, Renault and Mercedes). The vehicles main differences in terms of age, dimensions and passengers capacity are presented in table 2.
Table 2 – Characteristics each bus.
|
Vehicle |
A |
B |
C |
D |
E |
F |
G |
H |
I |
|
Age (years) |
28 |
22 |
13 |
12 |
10 |
6 |
3 |
3 |
2 |
|
Length (m) |
11.5 |
11.6 |
8.6 |
18.0 |
7.1 |
11.9 |
12.0 |
12.0 |
11.9 |
|
Height (m) |
3.1 |
3.1 |
3.0 |
3.2 |
3.0 |
3.1 |
3.0 |
3.0 |
3.2 |
|
Width (m) |
2.5 |
2.5 |
2.4 |
2.5 |
2.3 |
2.5 |
2.6 |
2.5 |
2.5 |
|
Capacity |
|||||||||
|
(passengers) 83 |
78 |
67 |
156 |
31 |
84 |
86 |
85 |
86 |
|
Vibration measurement
Vibration was measured with piezoelectric accelerometers from Brüel & Kjær. A triaxial accelerometer, model type 4322, was firmly fixed to the seat pan with straps. At the seat/floor interface, a unidirectional accelerometer, model type 4370, was fixed with a cementing stud.
The signals from the accelerometers were acquired fo r an average of thirty seconds in each trial with a real time frequency analyser model type 2144, also from Brüel & Kjær.
Multi- axis measurements reported were acquired in various operating conditions (e.g. different speeds, different bus models, different bus drivers, and different ground roughness roads).
Vibration measurements were accomplished according to ISO 2631-1 guidelines [6]. Real time analysis generated one- third octave frequency band (1- 80 Hz) spectra of root- mean- square (RMS) acceleration values along the three axes: x-back to front, y- left to right, and z- feet to head.
All measurements were conducted on weekdays at the same period of the day in order to avoid significant differences in terms of traffic flow and number of passengers.
Vibration evaluation
Weighted RMS acceleration values were obtained for each direction (x, y and z) from one- third octave band spectra using equation (1).
1
![]()
é ù 2iw å i ia = êêë i(w a )2 úúû(1)
aiw - weighted RMS acceleration for direction i;wi - weighting factors for one third octave band i, according to ISO 2631- 1 [6]; ai - RMS acceleration value for one third octave band i.
The vector sum or total values were obtained applying equation (2) to the weighted RMS acceleration values previously calculated for the three orthogonal directions.
aeqw =
![]()
(1.4.axw )2 + (1.4.ayw )2 + a2
(2)
zw
Seat transmissibility
The seat’s ability to reduce the actual vibration level transmitted to the driver was evaluated by means of the SEAT (Seat Effective Amplitude Transmissibility) factor. This factor was computed by the ratio between the RMS acceleration value at the seat pan level and the RMS acceleration value at the seat/floor interface. A SEAT value of 1 indicates that all input vibration is transferred without any dampening effect, whereas values greater than 1 illustrate an amplification of the transmitted vibration to the driver’s buttocks and lower spine. This evaluation was restricted to the z- axis.
Routes
Seven different urban routes, with extensions ranging from 8.5 km to 35.9 km, were used to collect data. Previous inspections of these itineraries permitted to identify road sections with identical ground roughness, so that measurements could be repeated and compared. Three types of surface were considered: brick paved, regular and irregular asphalt paved.
Questionnaire
The applied questionnaire was developed from the one proposed by Palmer and co- workers [10]. It was structured in four main parts which covered individual characteristics, occupational history, health complaints and individual habits.
RESULTS
Whole-body vibration exposure
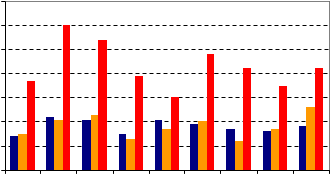
Figure 1 presents RMS acceleration values obtained for the three orthogonal directions defined by ISO 2631- 1 [6].
0.7
0.6
0.5

0.4
0.3
0.2
0.1
0
A B C D E F G H I
Vehicle
x-axis y-axis z-axis

 |
|
Figure 1 – Mean values of frequency- weighted RMS acceleration for the three orthogonal directions on the seat pan. |
The greatest frequency- weighted acceleration values were registered along the z- axis, which makes this the most severe direction. The mean frequency- weighted RMS acceleration values obtained were: 0.42 m s-2 , for the z- axis; 0.18 m s- 2 for both x and y- axes.
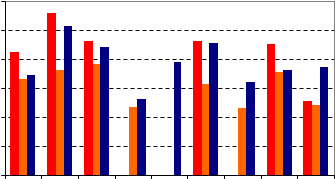
The comparison between mean vector sum values obtained on different ground
surfaces is presented in figure 2. Not all itineraries comprised the three types of surface considered. Therefore, models D and G were not analysed on brick paved surfaces (BP) and model E analysis was restricted to irregular asphalt paved (IAP) roads. Where applicable, brick paved surfaces were responsible for higher vector sum values, followed by the irregular asphalt paved ones.
1.2
1

0.8
0.6
0.4
BP RAP IAP
 |
|
0.20 |
A B C D E F G H I
Vehicles
Figure 2 – Mean vector sum values obtained for the nine bus models, running on different ground surfaces: BP- brick paved, RAP- regular asphalt paved, IAP- irregular asphalt paved.
The mean vector sum values obtained for all vehicle models were as follows: BP - 0.87 m s-2 ; IAP- 0.77 m s-2 ; RAP-0.61 m s-2 .
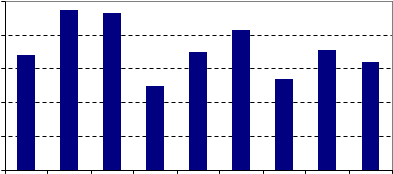
Figure 3 compares the vector sum values obtained for all bus models, regarding the health effects. Vehicles B, C and F presented the highest values, passing over the 0.8 m s- 2 boundary. The mean vector summed frequency- weighted RMS acceleration was equivalent to 0.72 m s-2 .
1
 |
|
0.8 |
0.6

|
0.40.20 |
A B C D E F G H I
Vehicle
Figure 3 - Mean vector sum values regarding the health effects.
From data showed in figure 3, time needed to reach both Exposure Action Value (EAV) and Exposure Limit Value (ELV), defined by the European Directive 2002/44/EC of 25
June [5], was computed and the results are resumed in table 3.
Table 3 – Time to reach EAV and ELV, defined by the European Directive 2002/44/EC, of 25 June [5].
Vehicle A B C D E F G H I to reach EA(h:min) V 4:20 2:13 2:19 8:00 4:05 2:54 6:52 3:58 4:53 Time to reach ELV(h:min) 22:53 11:43 12:14 >24h 21:36 15:21 >24h 20:59 >24h
Seat transmissibility
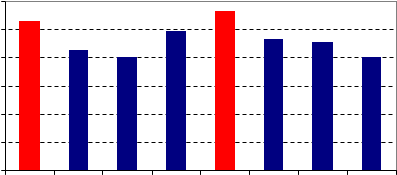
Due to technical difficulties, it was not possible to acquire SEAT factor values for vehicle G. Figure 4 shows the me an SEAT factor values obtained for the z- axis. The obtained mean seat transmissibility factor revealed values greater than 1 for vehicles A and E.
1.2
 |
|
1 |
0.8
 |
|
0.60.40.20 |
A B C D E F H I
Vehicle
Figure 4 - Mean SEAT factor values obtained for the z- axis.
Questionnaire data
Table 4 summarizes the most relevant outcomes from the questionnaires. Table 4 – Drivers self reported data.
Occupational history Health complaints Potential confounders Work shifts 69.7% Spine disorders 56.1% Smoking 36.4%
27.3%
Alcoholconsumption 41.5%
Previous WBV exposure Second job with
51.1 % Headache 51.6% Physical exercise 27.3%
WBV 7.6% Tiredness 65.2% Fixed meal time 6%
Pressure 78.8%
Most drivers work in a shift regime and take their meals at odd hours of the day. 51.5% of the drivers do overtime on a regular basis, which increases WBV exposure length. About half of the drivers were exposed to WBV in previous jobs and, in some
cases, it also happens in a secondary job. This fact contributes to the cumulative effect of vibration.
It was noticed that a significant percentage of the drivers increased their weight since they are engaged in the driving profession. An average weight growth of 10.6 kg (2-25 kg) was reported by 46.7% of the drivers.
Spine and gastrointestinal problems were the most reported health complaints. Reported spine complaints included low back pain (34.7%) and cervical pain (16.6%). Ulcers (10.6%), gastritis (10.6%) and abdominal pain (7.6 %) are among the reported problems of the digestive system.
Headaches are common among this group of drivers, as well as the tiredness sensation. They also complained about the fact of working under pressure most of the times.
Harmful habits such as smoking, consumption of alcoholic drinks, irregular meal time, and a passive lifestyle are common among bus drivers. A minority is engaged in some sort of regular physical exercise practice.
DISCUSSION
As previously observed in other vehicles [2 ,9], it is common the vertical direction to be the most severe for the driver. This is the case of all analysed buses and it assumes particular relevance when selecting means to attenuate the vibration transmission, e.g. seat suspensions.
Depending on the type and design of vehicles, drivers can be exposed to considerable levels of low- frequency vibration originating, primarily, from the vehicle- terrain interactions. Therefore, the study of ground surface roughness influence on the transmitted vibration is particularly relevant. It was possible to verify that brick paved surfaces were responsible for higher values of acceleration, followed by the irregular asphalt paved. Vehicle I was an exception due to the type of irregularities present along the whole itinerary.
Figure 3 shows that the larger bus (vehicle D) present ed the lowest vect or sum values, whereas the opposite happened in the smallest (vehicle F) and the older ones (B and C). This seems to be in agreement with the theory that states that vibration magnitude is inversely proportional to the system’s mass and higher in older vehicles.
From the analysis of table 3, it can be concluded that most drivers exceed the daily exposure action value established by the European directive. In this case, a programme of technical and/or organizational measures intended to reduce to a minimum the exposure to WBV and associated risks should be established and implemented. These may consider:
- use of other buses, transmitting less vibration to the driver;
- provision of auxiliary equipment to reduce the risk of injuries, such as seats that effectively reduce WBV;
- appropriate maintenance programmes for both the vehicle and the driver seat;
- design and layout of the driver’s stand;
- proper information and training to instruct drivers to adopt the right conduct in order to reduce their exposure to WBV to a minimum;
- limitation of the duration and intensity of the exposure;
- appropriate work schedules and rest periods.
The obtained mean seat transmissibility factor revealed va lues greater than 1, which means that the seat suspension system does not always attenuate the vibration transmission to the driver. This was the case in vehicle A (the older one) and vehicle E
(the smaller one). Vehicle D (the larger) revealed a value of 0.99. These results oppose to the enterprise policy of equipping all vehicles with the same type of seat suspension. Suspension selection should be made according to the vehicle’s characteristics and the ground surface profile. The range of anthropometric data covered by the drivers demands the seats’ suspension capacity of being adjusted to body weight.
A more careful analysis of the drivers’ behaviour showed that few of them do adjust seat regulations prior to begin service or do it correctly. On the other hand, some of the drivers prefer a loose ride with the suspension providing a floating like ride, while others prefer a ride with little or no seat travel at all. Therefore, differences on the seat’s ability to reduce transmis sibility are expected to occur and the presented results may not imply the seat inability to absorb vibration.
The applicability of the questionnaire’s results is restricted, namely because of the reduced sample size and the lack of a control group in this study. Nevertheless, the low back pain prevalence is in agreement with published results [2]. As for the gastrointestinal complaints, the presence of potential confounders does not allow further conclusions. A relevant founding was the weight growth prevalence. It seems that this occupation favours the phenomenon.
CONCLUSIONS
This study yielded the following conclusions:
D the most severe vibration to the drivers was transmitted along the z- axis;
D ground roughness is the main source of the vibration input to the vehicle;
D most drivers’ exposure to WBV exceed daily exposure action value defined by the European directive [5];
D seat suspension may be an effective way of reducing exposure;
D there is a cumulative effect of vibration exposure due to previous jobs, secondary occupations, and overtime practice;
D low back pain was the most referred symptom by the drivers;
D drivers information and training seems to be an effective measure to reduce their exposure to WBV and related effects to a minimum.
ACKNOWLEDGMENTS
This study was financially supported by the portuguese Direcção-Geral dos Transportes Terrestres and Fundo Social Europeu. The authors wish to thank all bus drivers who participated in the study.
REFERENCES
1- Boileau, P.- É. (2002). L'exposition à des vibrations globales du corps et son rôle dans l'étiologie des maux de dos. Travail et Santé, 18(1): 31-35.
2- Bovenzi, M., & Hulshof, C. T. J. (1999). An updated review of epidemiologic studies on the relationship between exposure to whole - body vibration and low back pain (1986- 1997). International Archives of Occupational and Environmental Health, 72(6): 351- 365 .
3- Bovenzi, M., & Zadini, A. (1992). Self - reported low back symptoms in urban bus drivers exposed to whole- body vibration. Spine, 17(9): 1048-1059.
4- Cann, A. P., Salmoni, A. W., & Eger, T. R. (2004). Predictors of whole - body
vibration exposure experienced by highway transport truck operators. Ergonomics,
47(13) : 1432- 1453.
5- European Parliament and Council (2002) Directive 2002/44/EC of 25 June: On the minimum health and safety requirements regarding the exposure of workers to the risks arising from physical agents (vibration), Official Journal of the European Communities, L177: 13- 19.
6- International Organization for Standardization (1997). ISO 2631 - 1: Mechanical vibration and shock – Evaluation of human exposure to whole - body vibration. Part 1: General requ irements.
7- Lings, S., & Leboeuf- Yde, C. (2000). Whole- body vibration and low back pain: a systematic, critical review of the epidemiological literature 1992- 1999. Internationa l Archives of Occupational and Environmental Health, 73(5): 290- 297.
8- Lyons, J. (2002). Factors contributing to low back pain among professional drivers: a review of current literature and possible ergonomic controls. Work: A Journal of Prevention, Assessment and Rehabilitation, 19(1): 95- 102.
9- Paddan, G. S., & Griffin, M. J. (2002). Evaluation of whole- body vibration in vehicles. Journal of Sound and Vibration, 253(1): 195- 213.
10- Palmer, K., Coggon, D., Pannett, B., & Griffin, M. (1998). The development of a self-administered questionnaire to assess exposures to hand-transmitted and whole - body vibration and their health effects. Journal of Sound and Vibration, 215(4): 653- 686.
11- Pope, M. H., Goh, K. L., & Magnusson, M. L. (2002). Spine ergonomics. Annual Review of Biomedical Engineering, 4: 49- 68.
12- Sherwin, L. M., Owende, P. M., Kanali, C. L., Lyons, J., & Ward, S. M. (2004).
Influence of tyre inflation pressure on whole -body vibrations transmitted to the
operator in a cut-to- length timber harvester. Applied Ergonomics, 35(3) : 253- 261.