


Meliá Navarro, Jose Luis
Universitat de València - Unitat d’Investigació de Psicometria - Facultat de Psicología - Avda. Blasco Ibañez, 21 - 46010 València - SpainTel: +34 96 386 45 48 - Jose.L.Melia@uv.eswww.uv.es/seguridadlaboralBecerril Galindo, MartaUniversitat de València - Unitat d’Investigació de Psicometria - Facultat de Psicologia - Avda. Blasco Ibañez, 21 46010 València - SpainVarcárcel Gonzalez, Pilar
Universitat de València - Departamento de Psicología Social - Facultat de Psicología - València - Spain
D’Oliveira, TeresaInstituto Superior de Psicología Aplicada (ISPA) - Lisboa - Portugal
ABSTRACT
ABSTRACT
Although several studies have described the characteristic risks of the construction sector as a whole, the heterogeneity of work-settings and tasks within the construction sector makes it necessary to identify more detailed job risk profiles. This study scales the perceived exposition to specific hazards, the perceived risk of suffering an accident, and the satisfaction with the work environment conditions of a sample of 3,362 Spanish construction workers divided into 17 construction jobs. Results provided support for the heterogeneity of risk across construction jobs and made it possible to group the risks in several levels.
Keywords
Keywords
Construction sector, occupational risk, construction job categories, risk scaling
INTRODUCTION
INTRODUCTION
All safety management and specific intervention strategies aim to manage and minimize risks at work. “The essence of risk management is: first, identify risks (measure in some way); second, assess potential seriousness (how important in the light of other factors); third, seek to influence associated outcomes (do something about it): and finally, monitor the effectiveness of interventions” (Glendon, Clarke & McKenna, 2006). Risk assessment is a key process to improve organizational safety that comprises the first two stages. Although risk assessment can be seen as a specific task that ought to be performed inside each company, the main hazards and associated risks are common to the jobs within a production sector. The risk levels affecting jobs in each sector can be considered as primary and necessary information to support satisfactory safety decisions, prevention assessments and intervention actions. A misunderstanding of the hazards and risks involved in each job within each sector may lead to an inadequate risk assessment and, even, to ignoring some hazards and risks.
There are several methods for estimating risk levels affecting jobs. Traditionally, a technical approach to workplace risk has defined risk as a product of the probability and magnitude of the occurrence of a hazardous event (Kletz, 2001). Following this approach, experts estimate risk by means of basic standardized methods (e.g., inspection checklists, safety audits, etc.) followed by some kind of probabilistic risk analysis, (e.g. event tree analysis). In spite of their subjective bases, these experts’ risk estimations are sometimes considered to be an objective approach to risk assessment. The main safety applications of this approach are interventions based on safety engineering or behaviour modification. Both preventive approaches have demonstrated their success in reducing accidents in the workplace (Geller, 2005). However, taking into account that workers’ performance is a direct precursor of safety, the worker perception of risk is also a necessary source of information in order to understand how risk affects safety behaviour and the probability of accidents. The workers’ risks estimations are considered the subjective risk at work (Rundmo, 1992), which can be defined as the subjective interpretation of the probability of a particular type of hazard being realized and the extent to which the individual is concerned about the consequences of that hazard (Fleming, Flin, Mearns, & Gordon, 1998). Standardized questionnaires are commonly used to evaluate the workers’ subjective risk estimations.
There has been extensive discussion about the similarity of the riskestimations developed by experts and workers. Some studies indicate that experts’ risk estimations do not necessarily correspond to workers’ risk estimations. They suggest that experts judge risk by taking into account the morbidity statistics, while non-experts are more sensitive to qualitative characteristics (e.g., Bye, & Lamvik, 2007; Slovic, 2000). However, others claim that there is no significant difference between experts’ estimations and workers’ estimations. According to these studies, experts do not judge risk differently and more accurately (Rowe and Wright, 2001), or as less risky than the non-experts (Wright, Pearman, & Yardley, 2000). Fleming, Flin, Mearns and Gordon (1998) concluded that workers had reasonably accurate perceptions of risks, and they pointed out that workers’ surveys about perceived risk can be used as an indicator of safety in organizations.
The assessment of workers’ subjective perceived risk has been consideredan important issue, due to its relationships with several individual and organizational outcomes, such as safety behaviour and occupational accidents. One of the main individual safety outcomes related to the perceived risk is safety behaviour (e.g., Morrow, & Crum, 1998; Rundmo, 1996; Van der Pligt, 1996). The perception of occupational risks existing in the work environment has been described as one of the main important processes related to the workers’ safety behaviour, and it has been considered a good indicator of the formal estimated level of safety (Rundmo, 2001). Regardless of the relationship between the risk perceived by workers and the risk perceived by safety technicians, the risk perceived by workers performs as a direct antecedent to workers’ safety response. The perceived risk is, more than any supposedly objective condition of risk, what can directly affect safety behaviour. It involves both the fulfillment of safety rules and procedures and the citizenship safety behaviour affecting safety participation. For example, the workers’ perceived risk has been demonstrated to be pivotal for the willingness to participate in health and safety programs (e.g., Cree, & Kelloway, 1997) or for other safety and health outcomes, such as the experience of burnout (e.g., Leiter, & Robichaud, 1997).
There is also evidence about the influence of the perception of risk onaccidents. Rundmo (1992) measured the perceived risk related to several major risk accident, ordinary risk accident and post accident measures in the offshore oil industry. He found that the perceived risk exerted an influence on the number of accidents and near misses. Finally, there are also studies providing evidence for the positive influence of the number of worker accidents on the perception of risk exposure (e.g., Argentero, Zanaletti, & Dell'Olivo, 2005).
The importance of the workers’ subjective perceived risk is based on its practical applications. This assessment could be valuable in complementing the riskestimations and in estimating the safety level in organizations more accurately, thus contributing to the understanding of safety behaviour and helping in the selection of preventive measures. This importance is reflected in the great quantity of studies devoted to the assessment of the workers’ subjective perceived risk in several sectors. Examples are provided in the offshore oil and natural gas sector (e.g., Fleming, Flin, Mearns, & Gordon, 1998; Rundmo, & Sjöberg, 1996; Rundmo, 2000), the manufacturing sector (e.g., Heathcote, & King, 1993), the agriculture sector (e.g., Salazar, Keifer, Negrete, Estrada, & Synder, 2005), the nuclear sector (e.g., Kivimäki, Kalimo, & Salminen, 1995; Sjöberg, 2003), the transport sector (Rundmo, & Moen, 2006), the healthcare sector (e.g., Ramsay, Denny, Szirontnyak, Thomas, Corneliuson, & Paxton, 2006) or the construction sector (Leather, 1987). The difference in hazardousness across sectors has been already pointed out as a key issue to be considered when testing organizational factors affecting occupational injuries (e.g., Smith, Huang, Ho, & Chen, 2006, Meliá, 1998).
In the Fourth European Working Conditions Survey, the European
Foundation for the Improvement of Living and Working Conditions describes a general picture of risk at work for 15 occupational sectors (Parent-Thirion, Fernández, Hurley, & Vermeylen, 2007). This survey reports on the strong correlation between working in specific sectors and the exposure to physical or ergonomic risk factors (vibrations, radiation, painful or tiring positions, repetitive hand or arm movements), biological or chemical risk factors (handling chemical products) and ambient or environmental risk factors (noise, low/high temperatures, breathing smoke/fumes/dust). In this European survey, the construction sector as a whole reports the highest level of exposure to each set of these risks.
Houtman, Andries, van den Berg, and Dhondt (2002) presented a reportabout the sectorial profiles of working conditions for 18 occupational sectors. Houtman et al. (2002) described the construction sector as an unfavourable sector in terms of environmental and ergonomic conditions, long working hours, high job demands and lack of social support, while it appeared as a favourable sector with regard to characteristics such as task flexibility, standard-hours, skilled work and low discrimination.
According to the sixth Spanish Survey on Working Conditions (MTAS, 2007),89.3 % of the construction workers perceived being exposed to suffering a work accident. This was the highest percentage in comparison with the percentage of workers who perceived being exposed to an occupational accident in the other main Spanish sectors: agriculture (80%), industry (80.3%) and service (64.3%). Construction workers, when compared with the other main sectors, perceived the highest level of exposition to the following specific accidents risks: (a) falls to lower levels (59.3%); (b) hits (48.8%); (c) cuts and pricks (42.1%); (d) falling objects, materials or tools (38.9%); (e) falls at the same level (31.7%); (f) collapses or landslides (26.3%); (g) particle or fragment projections (17.8%); (h) overstrains due to manual manipulation of heavy loads (15.2%); and (i) electrical contacts (12.9%). This survey also shows that construction workers are exposed at the highest level to the following environmental conditions: inhalation of toxic or harmful dust, fumes, aerosols, gases or vapours (46.6%), chemical risk exposure (49.1%), vibrations in hand and arms (23.5%) and vibration in the entire body (12.9%).
The current and increasing specialization of jobs in the majority of the occupational sectors has led several studies to also point out the importance of considering the differences in the existing risks even across worksites or subunits (e.g., Zohar, 2000, Meliá, 2005). Each specialized job consists of the development of a particular and expert set of tasks performed in specific work environments. It is reasonable to consider, and it is explicitly assumed by the legal concept of risk assessment, that these differential work tasks and conditions could produce a different specific exposition to occupational risks for each specialized job.
The complexity and variability of the current construction projects produce the existence of different work environments and demand the participation of many specialized construction jobs. Although it is possible to identify several types of construction projects (e.g., new building, rehabilitation, industrial, civil projects…),workers involved in them can be classified in seventeen general construction jobs: bricklayers, construction mates, moulding carpenters, construction specialists, welders, construction crane drivers, construction truck or van drivers, plumbers, electricians, painters, carpenters, construction services installers, construction bosses, construction clerks, construction business agents, high level technicians, and workers performing other construction tasks. These jobs are exposed to different sets of hazards, introducing a major source of variability and different risk profiles.
Although the available general pictures of risk in the construction sector are valuable, the variability of jobs within the sector implies the need for the identification of more specific risk profiles. These specific risk profiles could contribute more accurate knowledge about the main hazards and the level of risk affecting each construction job, and, hence, aid in the development of more precise intervention actions. The main purpose of this paper is to describe and scale the workers’ perceived risk associated with the exposition to the main hazards, the perceived risk of suffering an accident and the satisfaction with work environment conditions of the major construction jobs.
METHOD
The sample is formed by 3,362 Spanish employees, all of them working formally for construction companies. The majority of the participants were male (92.8%). 3.1% of the employees were less than 20 years old, 34% ranged between 20 and 29 years old, 31.4% ranged between 30 and 39 years old, 19.6% rangedbetween 40 and 49 years old, 10% ranged between 50 and 59 years old, and 1.9%were more than 59 years old. The sample was formed by employees in seventeen construction job categories: bricklayers (N=785), construction mates (N=532), moulding carpenters (N=183), construction specialists (N=107), welders (N=23), construction crane drivers (N=99), construction truck or van drivers (N=101), plumbers (N=100), electricians (N=157), painters (N=140), carpenters (N=77), construction services installers (N=116), construction bosses (N=283), construction clerks (N=184), construction business agents (N=47), high level technicians (N=323), and workers performing other construction tasks (N=105).
The sample filled out the HERC Battery (Meliá, 2004). This battery is a set ofdiagnostic tools for the assessment of the behavioural and psychosocial factors directly linked to work-related accidents in the construction sector. For the purpose of this study, the results of the following three scales of the HERC Battery have been considered: the Construction Hazards scale (CH), the Satisfaction with the Environmental Conditions scale (SEC) and the Perceived Probability of Accidents scale (PPA).
The CH scale measures the frequency with which workers perceived beingexposed to hazards characteristic of the construction activity, such as materials or tools sliding or falling, inhaling gases or dust, extreme temperatures, or falls to lower levels. (e.g., Risk of fall from a scaffold, a ladder or a ditch). The CH scale is formed by five items, which were answered on an 11-point Likert frequency scale ranging from “Never” to “Continuously”. Coefficient alpha is .82.
The SEC scale measures the frequency with which employees are satisfied with four main environmental conditions in construction: cleanliness, lighting, ventilation and temperature (e.g., The temperature at my place of work is satisfactory). This scale consists of 4 items. Items were answered on an 11-point Likert frequency scale ranging from “Never” to “Continuously”. Alpha is .81.
The PPA scale measures the extent to which workers perceive that they can suffer different types of accidents (e.g., Considering your training, your experience and the way you really work, how much real risk is there that you will suffer a fatal or very serious accident?). The PPA scale is made up of eight items. Items were answered on an 11-point Likert scale ranging from “None” to “Extreme”. Alpha is.89.
The score of a construction job on each scale is represented by the averagescores on the corresponding items of the workers belonging to this construction job category. On the three scales, scores have been rearranged to a 0-100 scale.
On the CH scale, 0 represents a complete absence of hazardous exposition and 100 represents a complete exposure to all hazards. On the SEC scale, 0 represents a complete dissatisfaction with the environmental conditions at work and 100 represents a complete satisfaction with them. On the PPA scale, 0 represents workers not perceiving any risk of suffering accidents at work and 100 represents workers perceiving a total risk of suffering work related accidents.
RESULTS
Table 1 shows the mean, the standard deviation and the Pearson correlations of the three variables for the whole sample. The workers’ exposition to hazards is significant and positively related to the perceived probability of accidents. Both the workers’ exposition to hazards and the perceived probability of accidents show significant negative correlations with the satisfaction with the environmental conditions. Construction employees who are exposed to high levels of hazards perceive high probabilities of suffering an accident at work, and they also present low satisfaction with the environmental conditions.
Table 1. Mean, standard deviation and Pearson correlations of the Construction Hazards scale (CH), the Satisfaction with the Environmental Conditions scale (SEC) and Perceived Probability of Accidents scale (PPA).
Scales Mean SD 1. CH 2. SEC1. CH 47.56 23.83 12. SEC 65.02 20.76 -.35* 13. PPA 39.79 19.46 .65* -.30**p<0.01
The perception of hazards
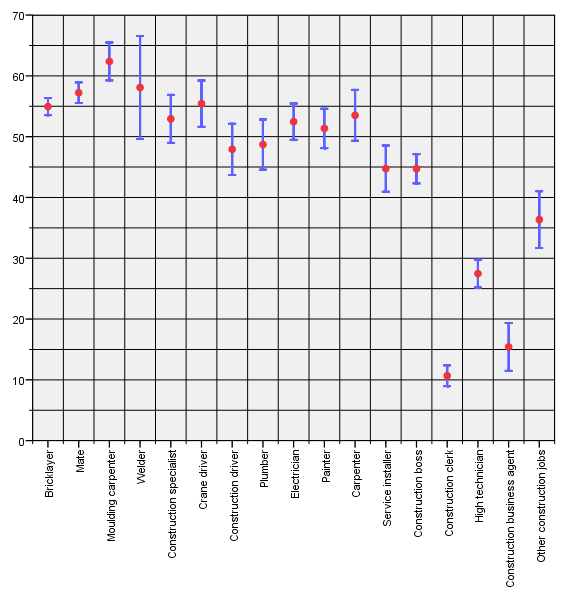
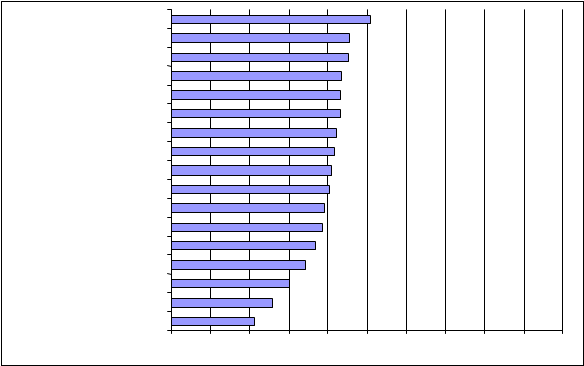
Figure 1 shows the results of the mean score on the CH scale for each of the seventeen construction jobs. Figure 2 shows the 95% confidence intervals around the mean of the CH scale for each construction job.
Results in both figures make it possible to divide construction jobs into four groups depending on the levels of exposure to specific construction hazards i.e., high level, middle-high level, middle-low level and low level.
I. High Level of hazards exposition. Moulding carpenters, welders, mates, crane drivers and bricklayers are the construction jobs at the highest level of risk exposition to hazards. This group encompasses jobs involved in earlier stages of construction projects, jobs that contribute to defining the structure of the building, and they cope with some of the more severe environmental conditions and unstructured work place conditions. All these groups present a percentage of hazards exposition above 54%, ranging between 54.946% for bricklayers and 62.36% for moulding carpenters.
II. Middle-high level of hazards exposition. Carpenters, construction specialists, electricians, painters and plumbers represent the middle- high level of risk exposition, ranging from 48.7% for plumbers and 53.5% for carpenters. These jobs operate in defined structures, but many of them sometimes close these structures or present serious specific professional risks.
III. Middle-low level of hazards exposition. Construction truck or van drivers, services installers and construction bosses represent the middle-low level of hazards exposition, ranging from 44.72% to 47.91% of hazard exposition. These professionals are not directlyinvolved in the development of the building structure, they generally work inside defined work settings, or they deal with hazards outside the construction place, such as traffic.
IV. Low-level of hazard exposition. High level technicians, construction business agents and construction clerks occupy the lowest level of exposition to construction hazards, ranging from 10.67% to 27.46% of hazard exposition. These white collar construction professionals usually work outside the building sites and access them only under selected circumstances; they do not have to manage materials or machines and are more exposed to characteristic tertiary psychosocial and ergonomic hazards. Although there is a progressive decrease in hazards exposition from level I to level III, all of them blue collar workers, there is a notorious gap between level III and level IV.
Figure 1. Mean of the Specific Hazards scale (CH) for each construction job.

Moulding carpenter
Welder Mate
Crane driver Bricklayer Carpenter
Construction specialist
Electrician
Painter Plumber Construction driver Service Installer Construction boss
Other construction jobs
High technician Construction business agent
Construction clerk
15.41
10.67
27.46
36.3562.36
58.08
57.22
55.42
54.946
53.50
52.92
52.46
51.35
48.70
47.91
44.73
44.72
0 10 20 30 40 50 60 70 80 90 100
Figure 2. Confidence interval (95%) around the mean for each construction job in the Specific Hazards scale (CH).
The satisfaction with the Environmental Conditions
Figure 3 shows the results of the mean on the SEC scale for each of the seventeen construction jobs, and figure 4 shows the 95% confidence intervals around the mean on the SEC scale for each construction job.
Construction clerks, high-level technicians, construction bosses and construction business agents have the highest level of satisfaction with environmental conditions at work. Carpenters, plumbers, truck or van drivers and painters show a middle-high level of satisfaction. Welders, construction services installers, crane drivers, bricklayers and electricians show a middle-low level of satisfaction. Mates, construction specialists and moulding carpenters show the lowest level of satisfaction.
Figure 3. Mean of the Satisfaction with the Environmental Conditions scale (SEC) for each construction job.
 |
|
Construction clerk High technician Other construction jobs Construction boss |
Construction business agent
Carpenter Plumber Construction driver
Painter
Welder Service Installer
Crane driver Bricklayer Electrician
Mate
Construction specialist Moulding carpenter74.24
73.67
70.14
69.56
68.19
65.90
64.59
64.3
64.19
63.58
62.96
62.67
62.48
62.27
61.00
60.88
60.160 10 20 30 40 50 60 70 80 90 100
Figure 4. Confidence intervals (95%) around the mean for each construction job in the Satisfaction with the Environmental Conditions scale (SEC)

The perceived probability of accidents
Figure 5 shows the results of the mean for the PPA scale for each of the seventeen construction jobs. Figure 6 shows the 95% confidence intervals around the mean on the PPA scale for each construction job. Moulding carpenters, carpenters, mates, bricklayers, painters and welders are the construction professionals that perceived the highest level of probability of suffering an accident during their workday. Electricians, crane drivers, services installers and construction specialists show a middle-high level of perceived risk. Truck or van drivers, plumbers and construction bosses perceived a middle-low level of probability of suffering an accident. High level technicians, construction business agents and clerks are the construction professionals showing the lowest perceived probability of suffering an accident.
Figure 5. Mean of the Perceived Probability of Accidents scale (PPA) for each construction job.
Moulding carpenter
Carpenter
Mate Bricklayer
Painter
Welder Electrician Crane driver Service Installer
Construction specialist Construction driver
Plumber
Construct. boss Other construction jobs
High technician Construction business agent
Construction clerk50.60
45.1044.87
43.3243.1342.85
42.02
41.38
40.58
40.2338.8338.27
36.5133.92
29.91
25.59
21.11
0 10 20 30 40 50 60 70 80 90 100
Figure 6. Confidence intervals (95%) around the mean for each construction job in the Perceived Probability of Accidents scale (PPA)
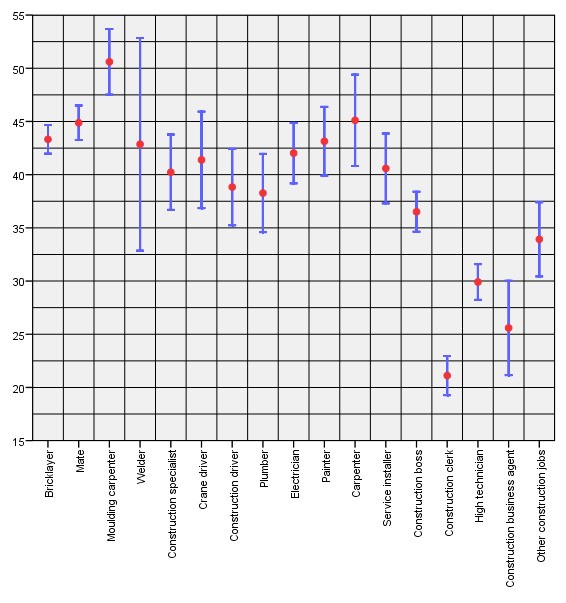
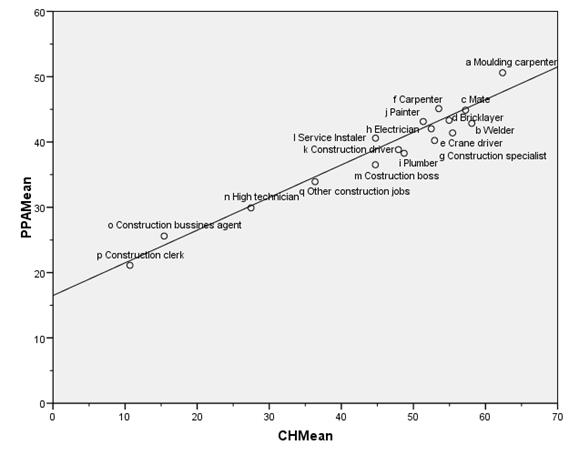
Table 2 and Figure 7 show the close relationship between the PPA and the CH at the job level. Using a percentage scale from 0 to 100 for both variables, the perceived probability of accidents increases roughly 0.5 points for each point of exposure to hazards; however, the equation suggests that the perceived probability of accidents started at 16.5 points where no hazard was perceived.
Table 2. Regression of the Perceived Probability of Accidents (PPA) over Construction Hazards (CH) at the job level (N=17).
|
B |
St. Err. |
Beta |
t |
Sig. |
|
|
(Constant) |
16,487 |
1,497 |
11,011 |
,000 |
|
|
CH Mean |
,488 |
,031 |
,970 |
15,573 |
,000 |
Figure 7. Scatter plot between Construction Hazards (CH) and Perceived Probability of Accidents (PPA) at the job level (means).
CONCLUSION
This study has presented the scaling of 17 construction jobs according to their exposition to hazards, the risk of suffering an accident and the satisfaction with the work environment conditions. This scaling was performed using a sample of 3,362 Spanish construction workers. The results show clearly that construction is not only a risky sector, but it is also a strongly heterogeneous sector, where different jobs present strong differences in their levels of exposition to hazards, probability of accidents and satisfaction with environmental conditions. These differences, related to the nature of the tasks performed and the step in the construction process when each job’s main activities are performed, should be taken into account in the development of prevention campaigns for the sector.
The perceived exposure to hazards and the perceived probability ofaccidents are closely related. However, on a 0 to 100 percentage scale, the perceived probability of accidents increases only 0’5 points when the exposure to hazards increases 1 point, although it starts at 16.5 points. For dangerous construction jobs, the mean perceived hazards exposure is roughly between 45% and 65%, and the mean perceived probability of accidents lies between 35% and 50%.
ACKNOWLWDGEMENTS
This paper was developed within the CONSTOOLKIT Project, [BIA2007- 61680], which focuses on the development of safety intervention tools for the psychosocial factors related to accidents in the construction sector. Financialsupport was provided by the Ministerio de Educación y Ciencia (España) and The European Regional Development Fund (ERDF - FEDER).
REFERENCES
- 1. Argentero, P., Zanaletti, W., & Dell'Olivo, B. (2005). Occupational risk perception, safety training and the prevention of injuries. Rivista di Psicologia del Lavoro e dell' Organizzazione, 11(3), 341366.
- 2. Bye, R., & Lamvik, G.M. (2007). Professional culture and risk perception: Coping with danger on board small fishing boats and offshore service vessels. Reliability Engineering and System Safety, 92, 1756–1763.
- 3. Cree, T., & Kelloway, K. (1997). Responses to occupational hazards: exist and participation. Journal of Occupational Health Psychology, 2(4), 304311.
- 4. Fleming, M., Flin, R., Mearns, K., & Gordon, R. (1998). Risk perceptions of offshore workers on UK oil and gas platforms. Risk Analysis, 18(1), 103110.
- 5. Geller, E. S. (2005). BehaviorBased safety and occupational risk management. Behavior modification, 29(3), 539561.
- 6. Heathcote, M., & King, J. (1993). Measuring and minimising risks. Personnel Management, 1, 6264.
- 7. Houtman, I., F. Andries, R. van den Berg and S. Dhondt (2002) Sectorial Profiles of Working Conditions. Dublin: European Foundation for the Improvement of Living and Working Conditions;
- 8. Kivimäki, M., Kalimo, R., & Salminen, S. (1995). Perceived nuclear risk, organizational commitment, and appraisals of management: a study of nuclear power plant personnel. Risk Analysis, 15(3), 391–396.
- 9. Kletz, T. (2001). An engineer’s view of human error (3rd ed.). Rugby, England: Institution of Chemical Engineers.
- 10. Leather, P. J. (1987). Safety and accidents in the construction industry: A work design perspective. Work & Stress, 1(2), 167174.
- 11. Leiter, M. P., & Robichaud, L. (1997). Relationships of occupational hazards with burnout: an assessment of measures and models. Journal of Occupational Health Psychology, 2(1), 3544.
- 12. Meliá, J. L. (2004). HERC Battery. Universidad de Valencia.
- 13. MTAS (2007). Sixth Spanish Survey on Working Conditions. Madrid: Ministerio de Trabajo y Asuntos Sociales.
- 14. ParentThirion, A., Fernández, E., Hurley, J., & Vermeylen, G. (2007). Fourth European working conditions survey. Luxembourg: Office for Official Publications of the European Communities.
- 15. Morrow, P. C., & Crum, M. R. (1998). The effects of perceived and objective safety risk on employee outcomes. Journal of Vocational Behavior, 53, 300313.
- 16. Ramsay, J., Denny, F., Szirotnyak, K., Thomas, J., Corneliuson, E., &; Paxton, K. L. (2006). Identifying nursing hazards in the emergency department: A new approach to nursing job hazard analysis. Journal of Safety Research, 37(1), 63 74.
- 17. Rowe, G., & Wright, G. (2001). Differences in expert and lay judgments of risk: myth or reality?. Risk Analysis, 21(2), 341356.
- 18. Rundmo, T. (1992). Risk perception and safety on offshore petroleum platforms Part II: Perceived risk, job stress and accidents. Safety Science, 15, 5368.
- 19. Rundmo. T. (2000). Safety climate, attitudes and risk perception in Norsk Hydro. Safety Science, 34(13), 4759.
- 20. Rundmo, T. (2001). Employee images of risk. Journal of Risk Research, 4(4), 393404.
- 21. Rundmo, T., & Moen, B. (2006). Risk perception and demand for risk mitigation in transport: a comparison of lay people, politicians and experts. Journal of Risk Research, 9(6), 623640.
- 22. Rundmo, T., & Sjöberg, L. (1996). Employee risk perception related to offshore oil platform movements. Safety Science, 24(3), 211277.
- 23. Salazar, M. K., Keifer, M., Negrete, M., Estrada, F., & Synder, K. (2005). Occupational Risk Among Orchard Workers: A Descriptive Study. Family & Community Health, 28(3), 239252.
- 24. Sjöberg, L. (2003). Attitudes and risk perceptions of stakeholders in a nuclear waste siting issue. Risk Analysis, 23 (4), 739–749.
- 25. Slovic, P. (2000). The perception of risk. London: Earthscan Publications.
- 26. Smith, G. S., Huang, Y. H., Ho, M., & Chen, P. Y. (2006). The relationship between safety climate and injury rates across industries: The need to adjust for injury hazards. Accident Analysis & Prevention, 38(3), 556562.
- 27. Van der Pligt, J. (1996). Risk perception and selfprotective behavior. European Psychologist, 1, 3443.
- 28. Wright, G., Pearman, A., & Yardley, K. (2000). Risk perception in the U.K. oil and gas production industry: Are expert lossprevention managers' perceptions different from those of members of the public?. Risk Analysis, 20(5), 681690.
- 29. Zohar, D. (2000). A grouplevel model of safety climate: Testing the effect of
group climate on microaccidentes in manufacturing jobs. Journal of Applied Psychology, 85(4), 587-596.
Papers relacionados